Fig. 12

Download original image
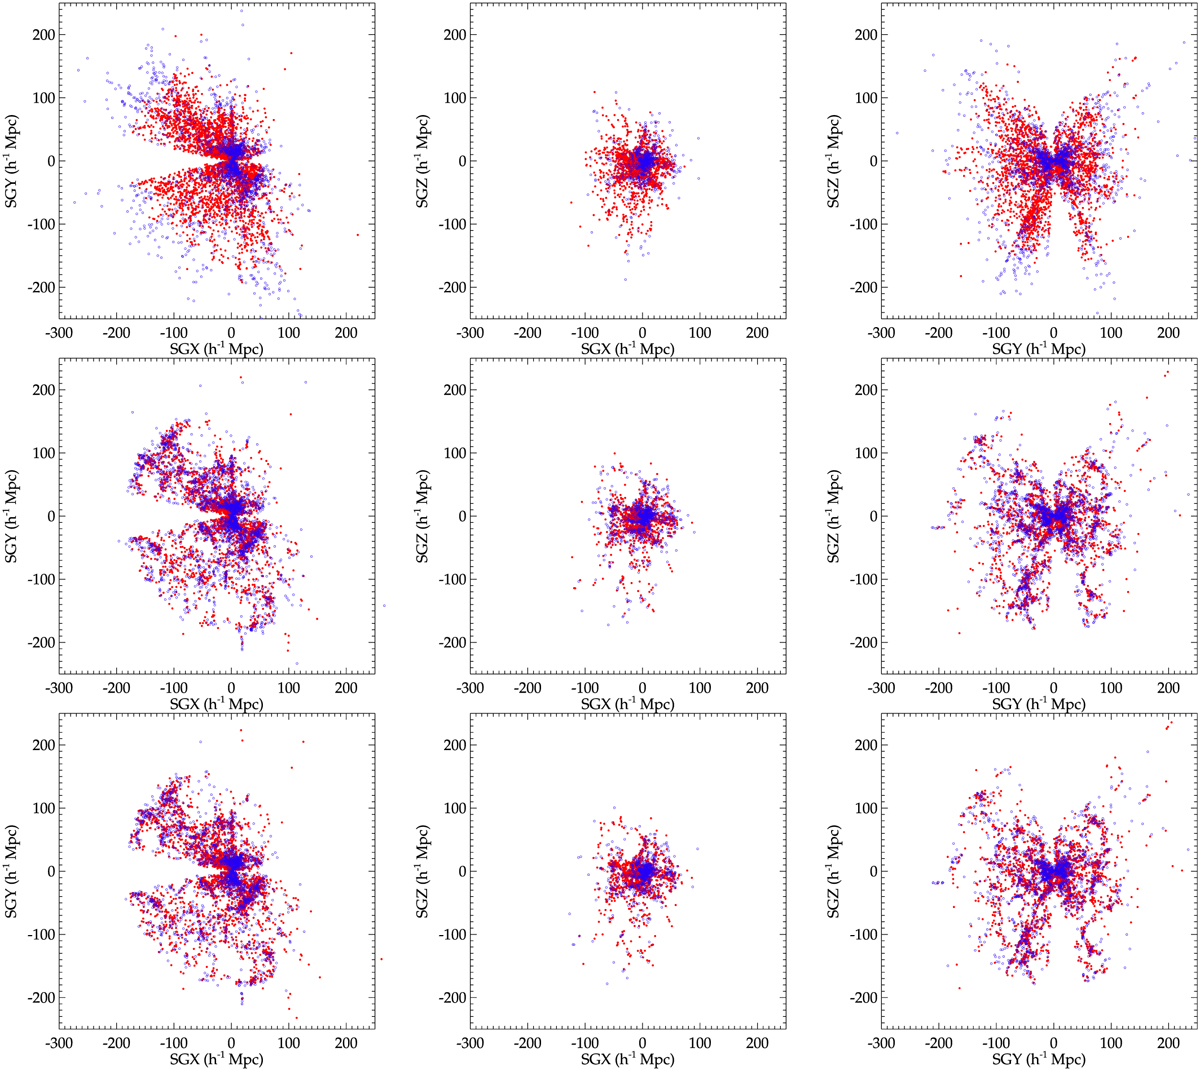
Distribution of galaxies. From top to bottom: in the raw, corrected, ten stacked realization third catalog of the Cosmicflows project in the three supergalactic 40 h−1 Mpc thick slices (from left to right). Blue circles stand for galaxies with negative peculiar velocities. Red filled circles represent galaxies with positive peculiar velocities. The strong biases affecting the raw catalog (top) is clearly visible with negative velocities at large distances. The filamentary structure of the cosmic web is visible in the corrected catalogs.
Current usage metrics show cumulative count of Article Views (full-text article views including HTML views, PDF and ePub downloads, according to the available data) and Abstracts Views on Vision4Press platform.
Data correspond to usage on the plateform after 2015. The current usage metrics is available 48-96 hours after online publication and is updated daily on week days.
Initial download of the metrics may take a while.


