Fig. 11
Download original image
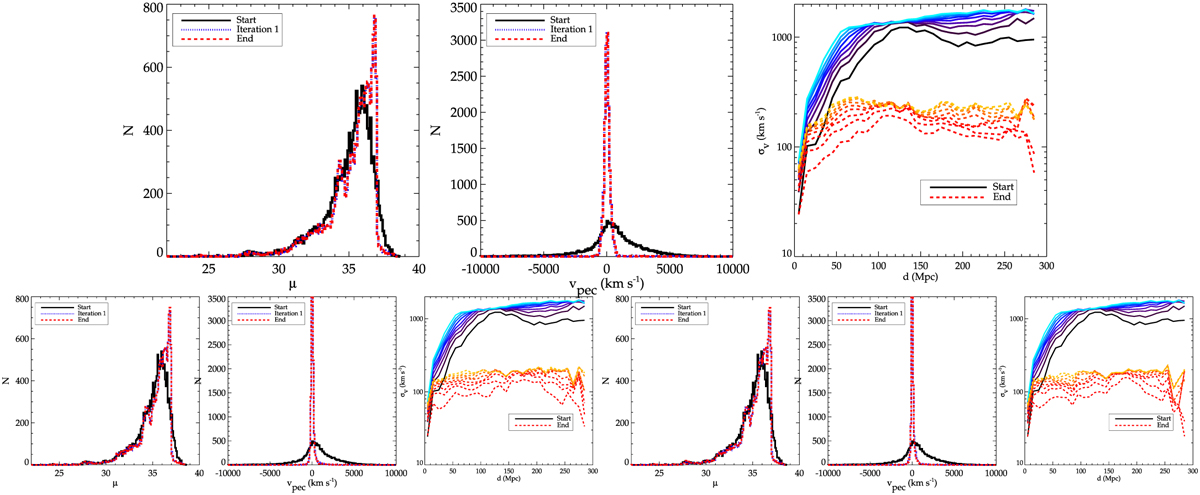
Comparisons between spatial distribution and velocity properties of the observed catalog before and after bias-minimization. From left to right: distance modulus histograms, peculiar velocity distributions obtained from the raw (black solid line) and corrected (blue and red dotted and dashed lines) observational catalogs as well as the small-scale velocity variance (solid cold color vs. dashed warm color lines respectively). Top to bottom left and right: results for one distribution, for five and ten stacked realizations.
Current usage metrics show cumulative count of Article Views (full-text article views including HTML views, PDF and ePub downloads, according to the available data) and Abstracts Views on Vision4Press platform.
Data correspond to usage on the plateform after 2015. The current usage metrics is available 48-96 hours after online publication and is updated daily on week days.
Initial download of the metrics may take a while.