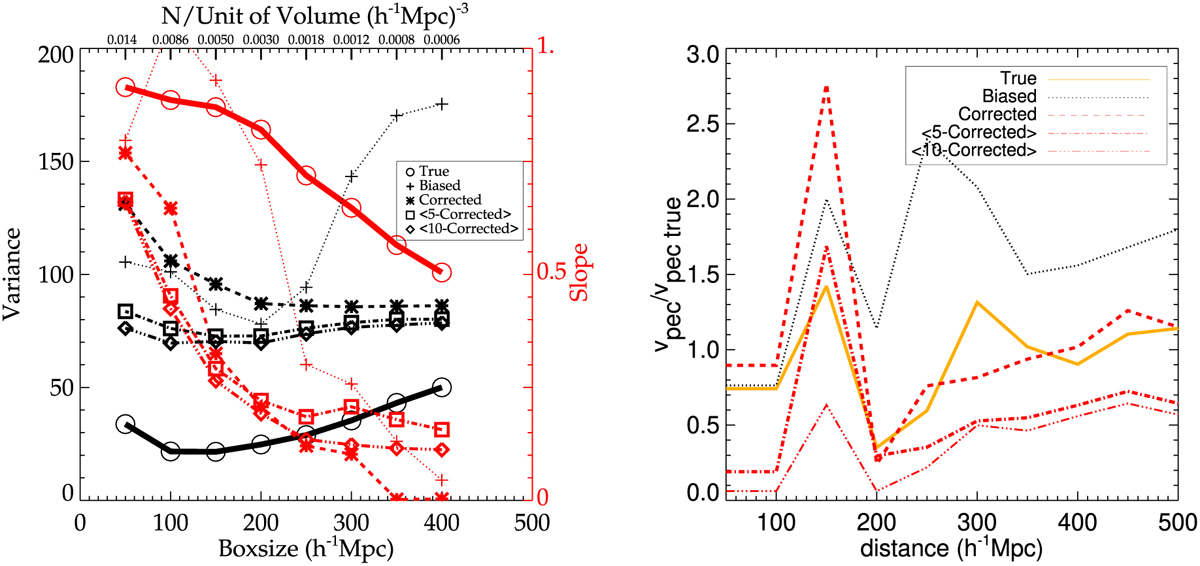
Fig. 10
Download original image
Comparisons of the velocity fields reconstructed from the different datasets. Left: variances (black color) and slopes (red color) of linear fits to cell-to-cell simulated/reconstructed velocity field comparisons considering larger and larger sub-volumes of the total boxes. The variance, namely, the difference between the reconstructed and simulated velocities, is the greatest when using the biased catalog (black crosses) - especially when considering the largest sub-volumes - and the smallest when using the true catalog (black circles) to reconstruct the fields. It has intermediate values when the corrected catalogs (black stars, squares, and diamonds) are used to reconstruct the fields. The slopes are smaller than 1 in all but one point for the biased-catalog-based reconstruction. It represents a well-known effect of the Wiener-filter technique that goes to the mean field in absence of data, implying reconstructed velocities with null values to be compared to simulated velocities in this case. Right: ratio between reconstructed and simulated velocities at the sole positions of the selected-for-the-mock-catalog halos as a function of the latter’s distance. If the Wiener-filter tends to underestimate velocities when using corrected stacked-realization catalogs (dotted-dashed and three-dots-dashed red lines) for reconstruction, it does so quasi uniformly in the whole volume. It makes further corrections of Wiener-filter reconstructions easier than when using the biased catalog for the reconstructions. In the latter case (black dotted line), velocities are indeed alternatively under and overestimated with large fluctuations.
Current usage metrics show cumulative count of Article Views (full-text article views including HTML views, PDF and ePub downloads, according to the available data) and Abstracts Views on Vision4Press platform.
Data correspond to usage on the plateform after 2015. The current usage metrics is available 48-96 hours after online publication and is updated daily on week days.
Initial download of the metrics may take a while.