Fig. A.1.
Download original image
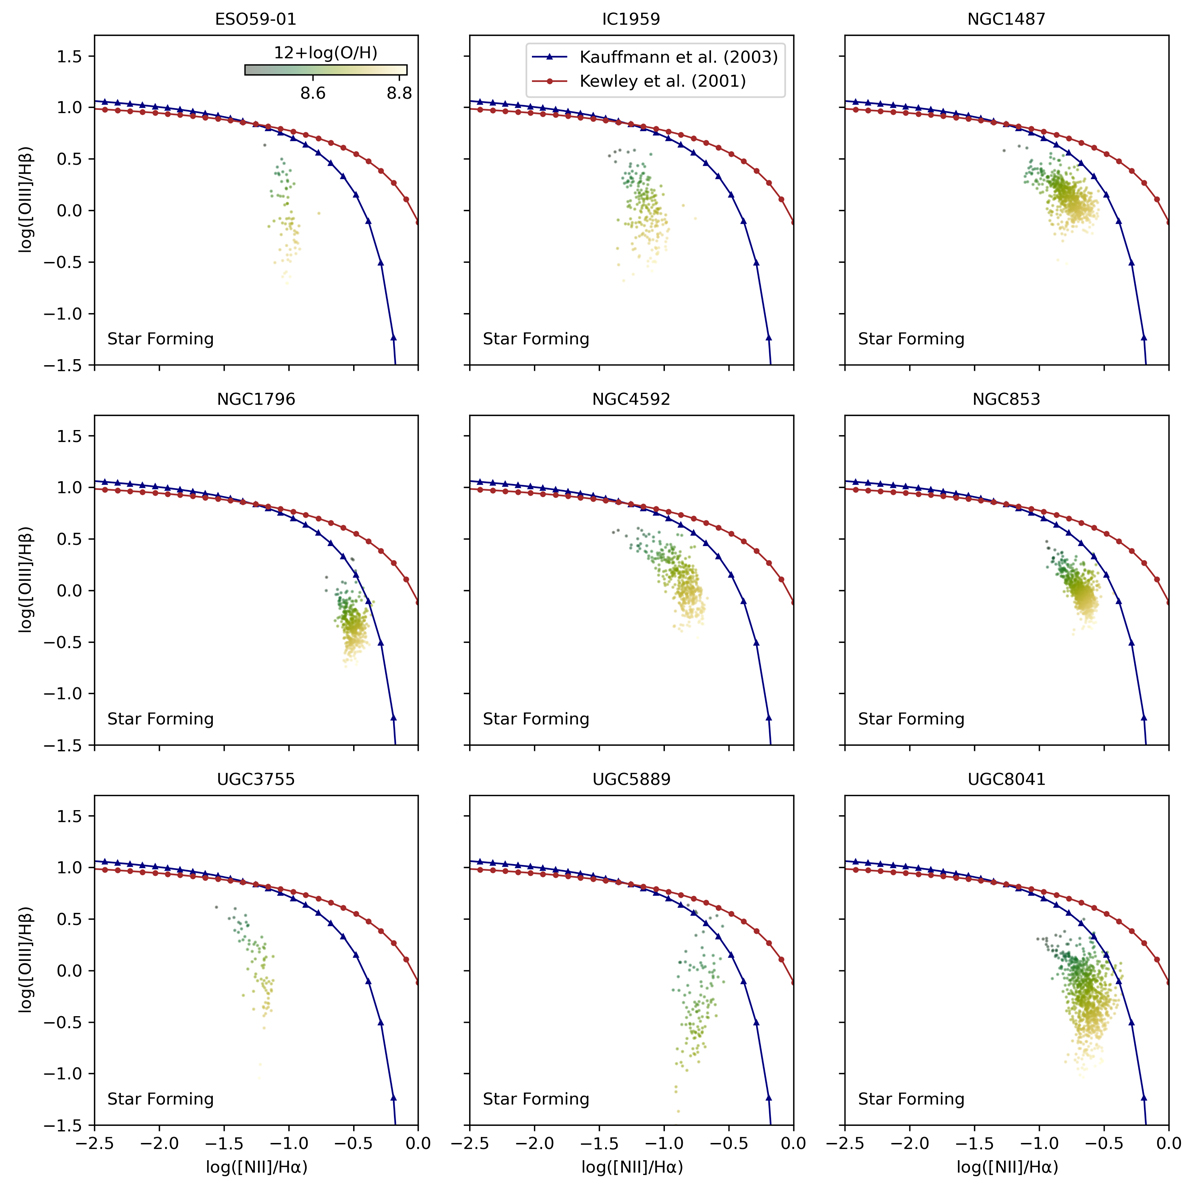
Baldwin, Phillips & Terlevich (BPT) diagnostic diagrams for the galaxy sample, with two literature models, as per Kewley et al. (2001) (red curve) and Kauffmann et al. (2003) (blue curve). The star-forming region lies below the two model curves. The points are obtained from binned data, with a bin size of 100 pc and colour-coded by the gas-phase metallicity: 12 + log(O/H).
Current usage metrics show cumulative count of Article Views (full-text article views including HTML views, PDF and ePub downloads, according to the available data) and Abstracts Views on Vision4Press platform.
Data correspond to usage on the plateform after 2015. The current usage metrics is available 48-96 hours after online publication and is updated daily on week days.
Initial download of the metrics may take a while.