Open Access
Fig. 7.
Download original image
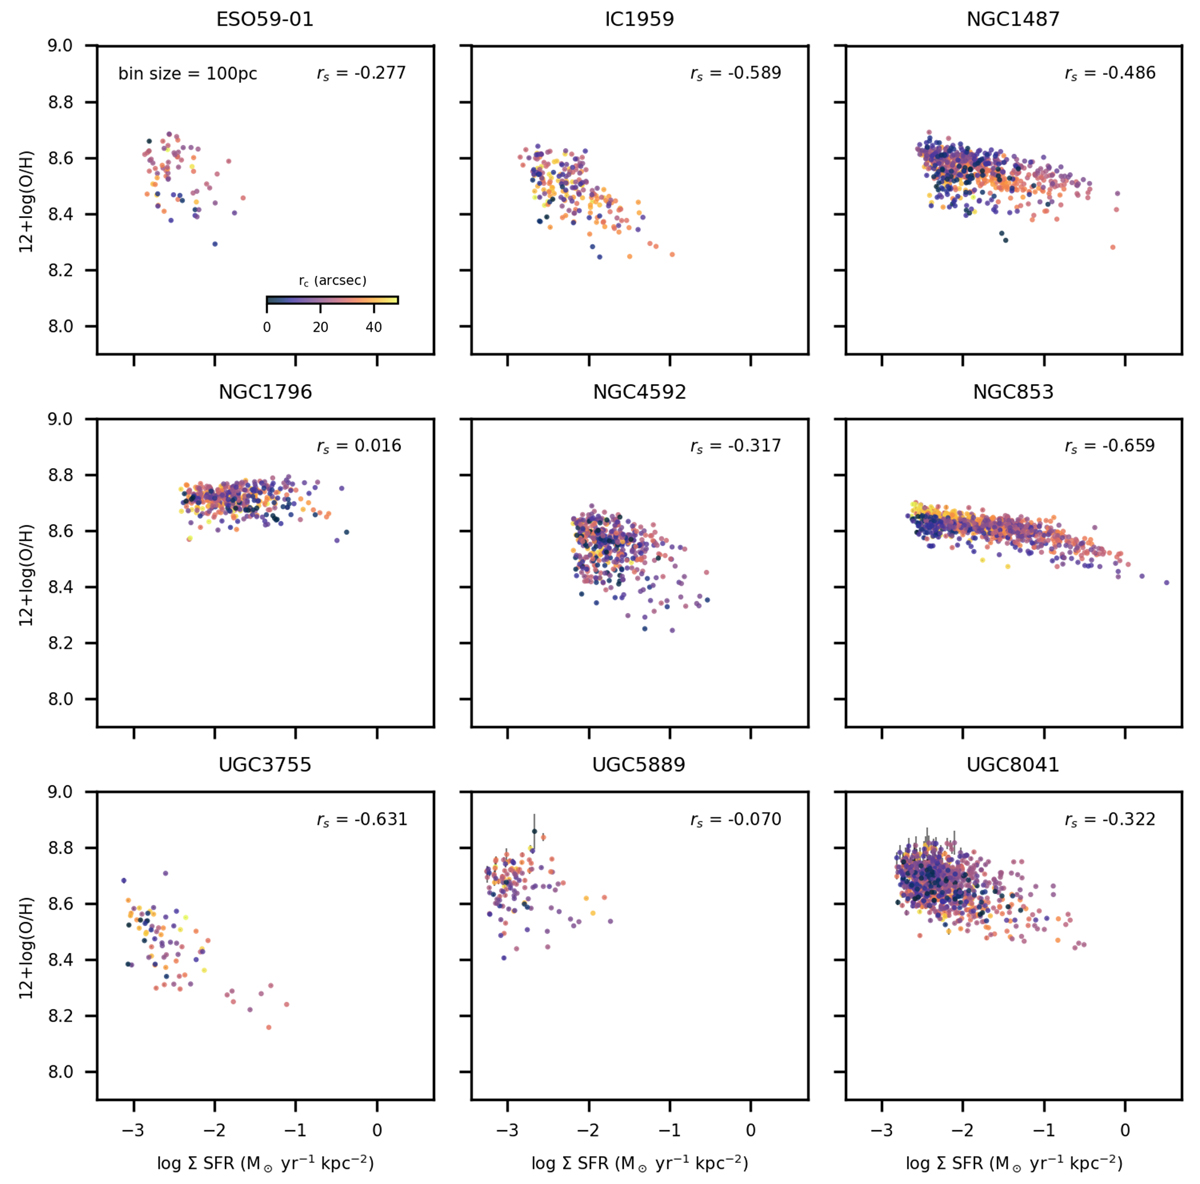
Gas-phase metallicity dependence on the star-formation-rate surface density for the galaxy sample. The plots include the binned data (bin size = 100 pc) obtained after the corrections, colour-coded by the distance from the galaxy centre rc. The Spearman’s correlation coefficients, rs, are shown in all of the plots.
Current usage metrics show cumulative count of Article Views (full-text article views including HTML views, PDF and ePub downloads, according to the available data) and Abstracts Views on Vision4Press platform.
Data correspond to usage on the plateform after 2015. The current usage metrics is available 48-96 hours after online publication and is updated daily on week days.
Initial download of the metrics may take a while.