Open Access
Fig. 1.
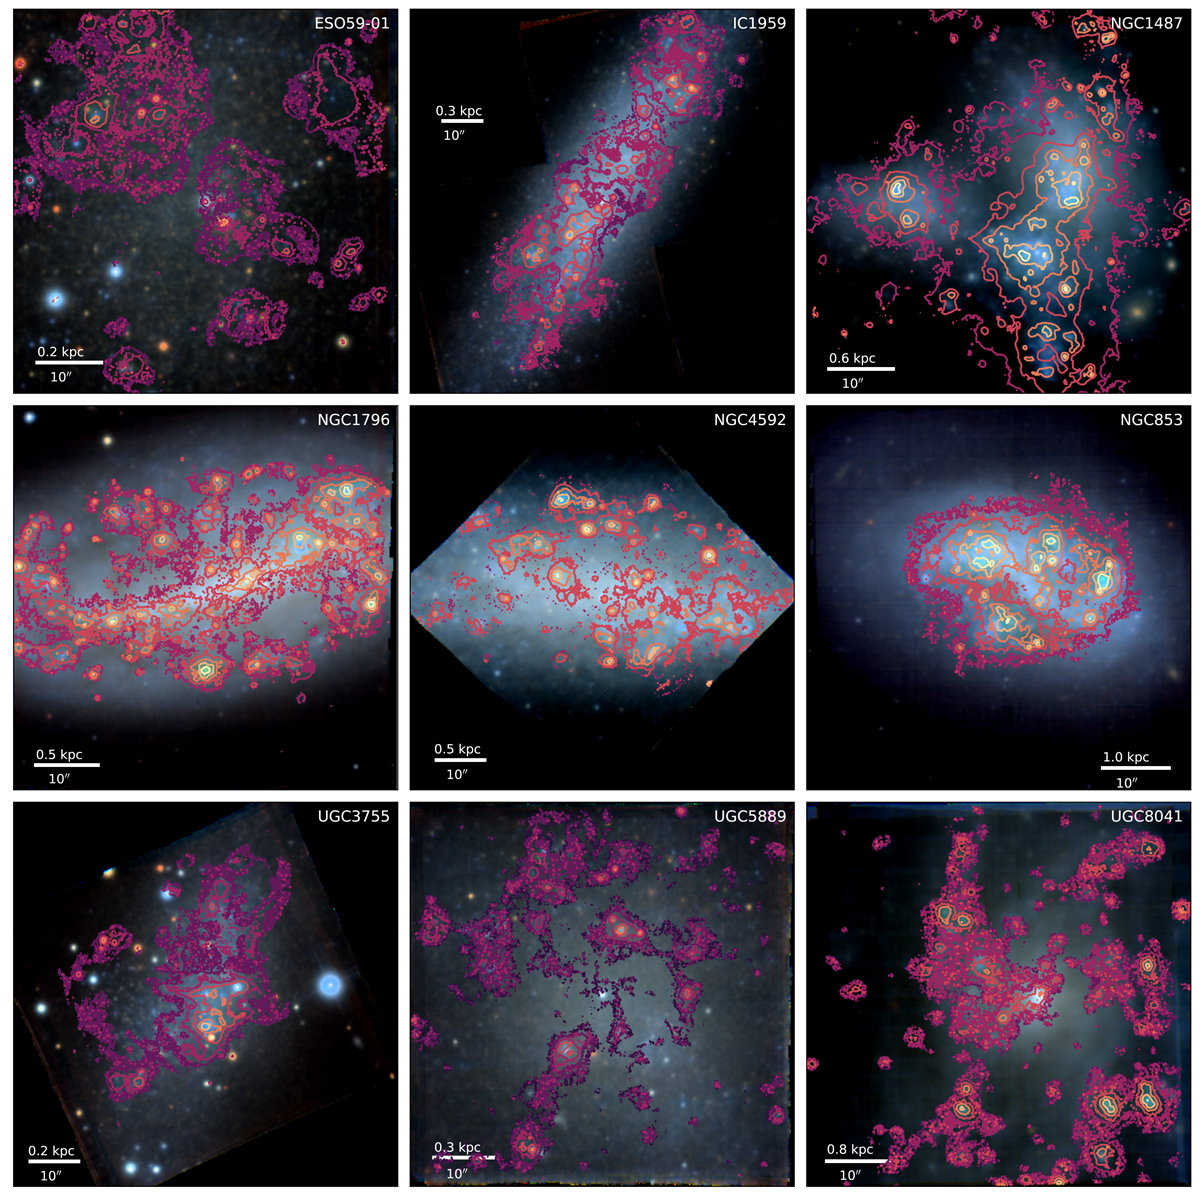
Download original image
RGB images of the nine galaxies in our sample obtained from the MUSE cubes. The purple lines mark extinction-corrected Hα flux contours as obtained from running DAP on the original data. The contours mark fluxes from 10−18 to 10−15 erg s−1 in 0.5 dex intervals.
Current usage metrics show cumulative count of Article Views (full-text article views including HTML views, PDF and ePub downloads, according to the available data) and Abstracts Views on Vision4Press platform.
Data correspond to usage on the plateform after 2015. The current usage metrics is available 48-96 hours after online publication and is updated daily on week days.
Initial download of the metrics may take a while.