| Issue |
A&A
Volume 679, November 2023
|
|
|---|---|---|
| Article Number | C1 | |
| Number of page(s) | 3 | |
| Section | Astrophysical processes | |
| DOI | https://doi.org/10.1051/0004-6361/202345958e | |
| Published online | 03 November 2023 | |
Flavor composition of neutrinos from choked gamma-ray bursts (Corrigendum)
Instituto de Investigaciones Físicas de Mar del Plata (IFIMAR – CONICET), and Departamento de Física, Facultad de Ciencias Exactas y Naturales, Universidad Nacional de Mar del Plata, Funes 3350, (7600) Mar del Plata, Argentina
e-mail: This email address is being protected from spambots. You need JavaScript enabled to view it.
Key words: astroparticle physics / neutrinos / gamma-ray burst: general / errata, addenda
We found the following misprints in the original manuscript:
-
In the Introduction, the correct name of the Seyfert galaxy referred to is NGC 1068.
-
In Eq. (1), there was a typo in the luminosity units, which should be erg s−1.
-
In Eq. (20), there was a missing minus sing in the last member on the right, that is, it should read as follows:
 (20)
(20) -
In the Acknowledgements section, the correct acronym for the financial support agency is ANPCyT.
Finally, Figs. (17) and (18) in the original paper correspond to a slightly different set of parameters than those presented in the paper. Therefore, we include below the correct versions of the above mentioned figures showing the flavor ratios obtained with the intergrated neutrino fluxes. The entirety of the discussion and conclusions remain valid as originallystated.
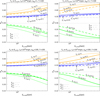 |
Fig. 17. Flavor ratios of the integrated fluxes of neutrinos with energy above Eν,min for L0 = 1050erg s−1 (left panels) and L0 = 1051erg s−1 (right panels). All plots are for Γ = 100. The top plots correspond to aep = 1 and the bottom ones to aep = 100. The green, orange, and blue curves correspond to the electron, muon, and tau flavor ratios, respectively. The long-dashed, solid, and short-dashed lines refer to the results for ϵB = 0.01, ϵB = 0.1, and ϵB = 1, respectively. The flavor ratios expected without considering losses are indicated with gray dotted lines for the electron flavor, gray long-dashed lines for the muon flavor, and gray long-short dashed lines for the tau flavor. |
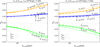 |
Fig. 18. Flavor ratios of the integrated fluxes of neutrinos with energy above Eν,min for L0 = 1050erg s−1 (left panels) and L0 = 1051erg s−1 (right panels). Both plots are for Γ = 100. The green, orange, and blue curves correspond to the electron, muon, and tau flavor ratios, respectively. The long-dashed, solid, and short-dashed lines refer to the results for ϵB = 0.01, ϵB = 0.1, and ϵB = 1, respectively. The flavor ratios expected without considering losses are indicated with gray dotted lines for the electron flavor, gray long-dashed lines for the muon flavor, and gray long-short dashed lines for the tau flavor. |
© The Authors 2023
 Open Access article, published by EDP Sciences, under the terms of the Creative Commons Attribution License (https://creativecommons.org/licenses/by/4.0), which permits unrestricted use, distribution, and reproduction in any medium, provided the original work is properly cited.
This article is published in open access under the Subscribe to Open model. This email address is being protected from spambots. You need JavaScript enabled to view it. to support open access publication.
All Figures
|
Fig. 17. Flavor ratios of the integrated fluxes of neutrinos with energy above Eν,min for L0 = 1050erg s−1 (left panels) and L0 = 1051erg s−1 (right panels). All plots are for Γ = 100. The top plots correspond to aep = 1 and the bottom ones to aep = 100. The green, orange, and blue curves correspond to the electron, muon, and tau flavor ratios, respectively. The long-dashed, solid, and short-dashed lines refer to the results for ϵB = 0.01, ϵB = 0.1, and ϵB = 1, respectively. The flavor ratios expected without considering losses are indicated with gray dotted lines for the electron flavor, gray long-dashed lines for the muon flavor, and gray long-short dashed lines for the tau flavor. |
| In the text | |
|
Fig. 18. Flavor ratios of the integrated fluxes of neutrinos with energy above Eν,min for L0 = 1050erg s−1 (left panels) and L0 = 1051erg s−1 (right panels). Both plots are for Γ = 100. The green, orange, and blue curves correspond to the electron, muon, and tau flavor ratios, respectively. The long-dashed, solid, and short-dashed lines refer to the results for ϵB = 0.01, ϵB = 0.1, and ϵB = 1, respectively. The flavor ratios expected without considering losses are indicated with gray dotted lines for the electron flavor, gray long-dashed lines for the muon flavor, and gray long-short dashed lines for the tau flavor. |
| In the text | |
Current usage metrics show cumulative count of Article Views (full-text article views including HTML views, PDF and ePub downloads, according to the available data) and Abstracts Views on Vision4Press platform.
Data correspond to usage on the plateform after 2015. The current usage metrics is available 48-96 hours after online publication and is updated daily on week days.
Initial download of the metrics may take a while.