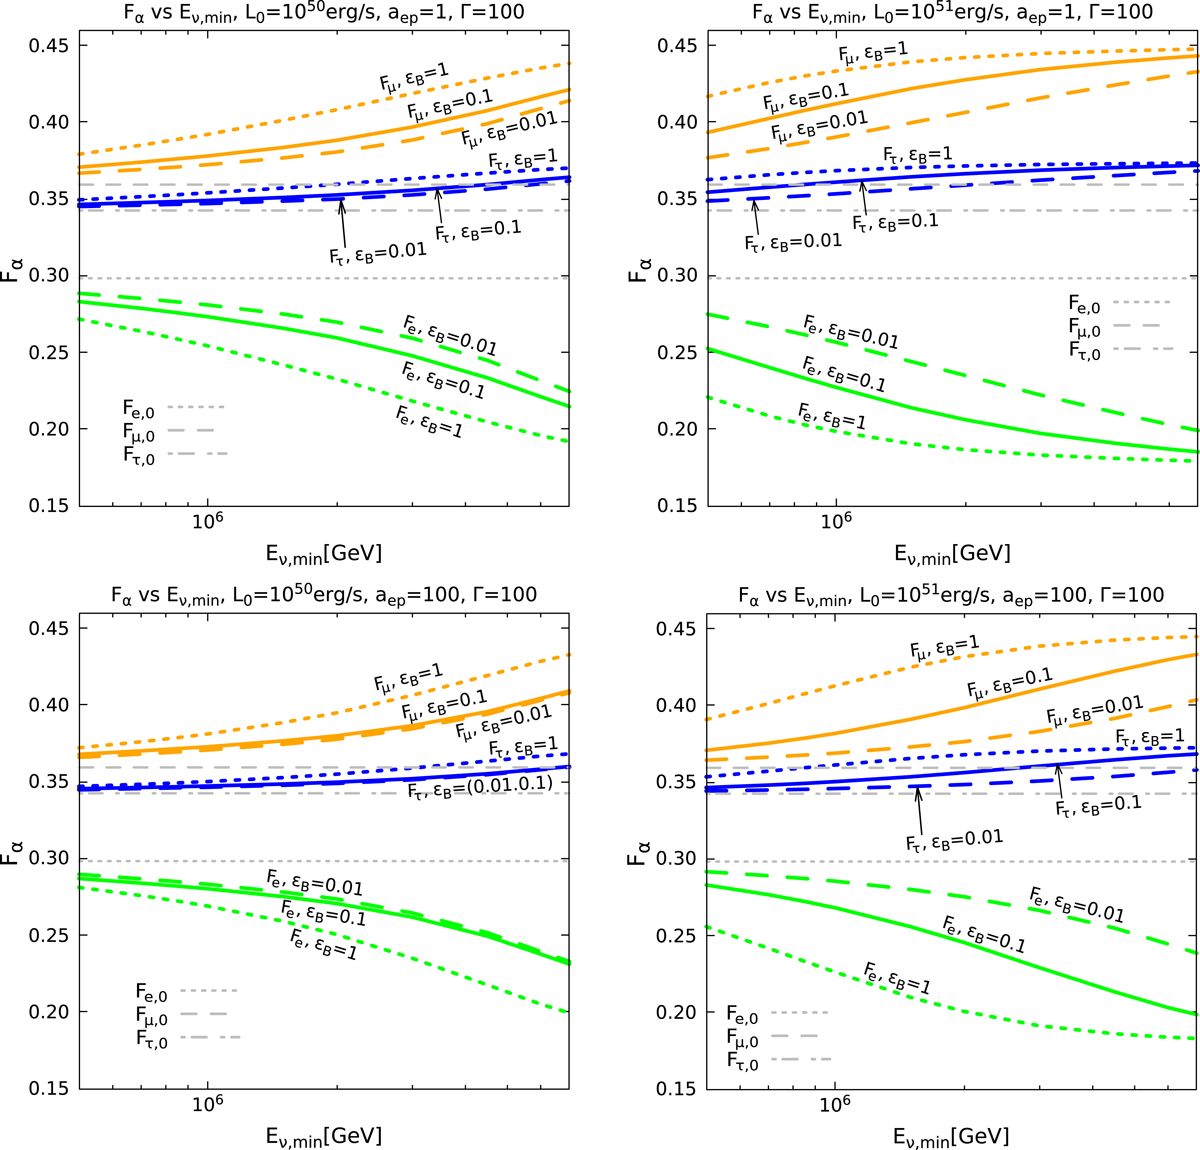
Fig. 17.
Download original image
Flavor ratios of the integrated fluxes of neutrinos with energy above Eν,min for L0 = 1050erg s−1 (left panels) and L0 = 1051erg s−1 (right panels). All plots are for Γ = 100. The top plots correspond to aep = 1 and the bottom ones to aep = 100. The green, orange, and blue curves correspond to the electron, muon, and tau flavor ratios, respectively. The long-dashed, solid, and short-dashed lines refer to the results for ϵB = 0.01, ϵB = 0.1, and ϵB = 1, respectively. The flavor ratios expected without considering losses are indicated with gray dotted lines for the electron flavor, gray long-dashed lines for the muon flavor, and gray long-short dashed lines for the tau flavor.
Current usage metrics show cumulative count of Article Views (full-text article views including HTML views, PDF and ePub downloads, according to the available data) and Abstracts Views on Vision4Press platform.
Data correspond to usage on the plateform after 2015. The current usage metrics is available 48-96 hours after online publication and is updated daily on week days.
Initial download of the metrics may take a while.