Fig. 9.
Download original image
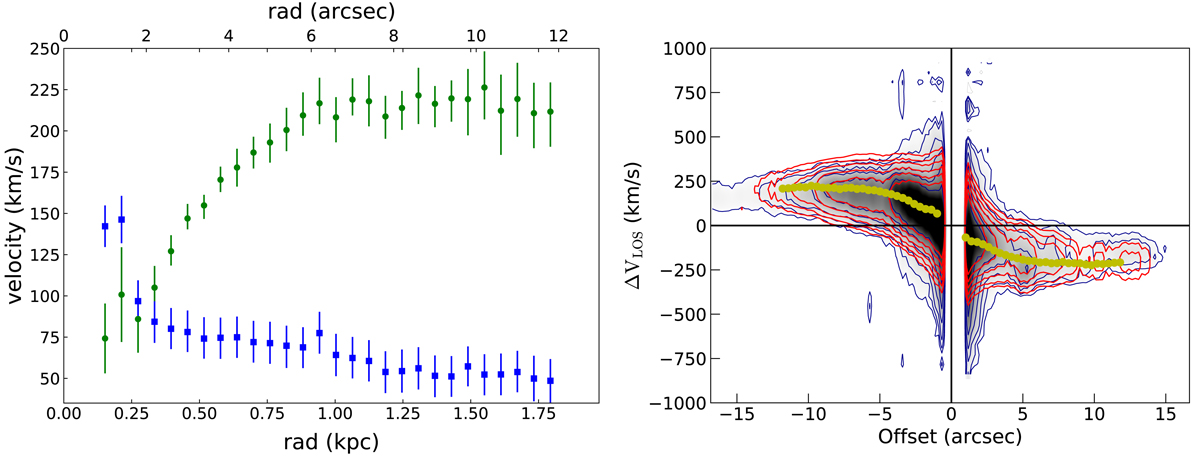
3DBAROLO dynamical model of the ionised gas disc obtained by fitting the Hα data cube. Left panel: rotation curve (green symbols) and velocity dispersion (blue symbols) corrected for beam smearing, as a function of the radius obtained from the best-fit disc model. Right panel: position–velocity diagram along the kinematic major axis, PA = 210 deg. Red contours and yellow filled circles represent the disc model, blue contours represent the data. Contours are drawn at (1, 2, 4, 8, 16, 32, 64)σ.
Current usage metrics show cumulative count of Article Views (full-text article views including HTML views, PDF and ePub downloads, according to the available data) and Abstracts Views on Vision4Press platform.
Data correspond to usage on the plateform after 2015. The current usage metrics is available 48-96 hours after online publication and is updated daily on week days.
Initial download of the metrics may take a while.