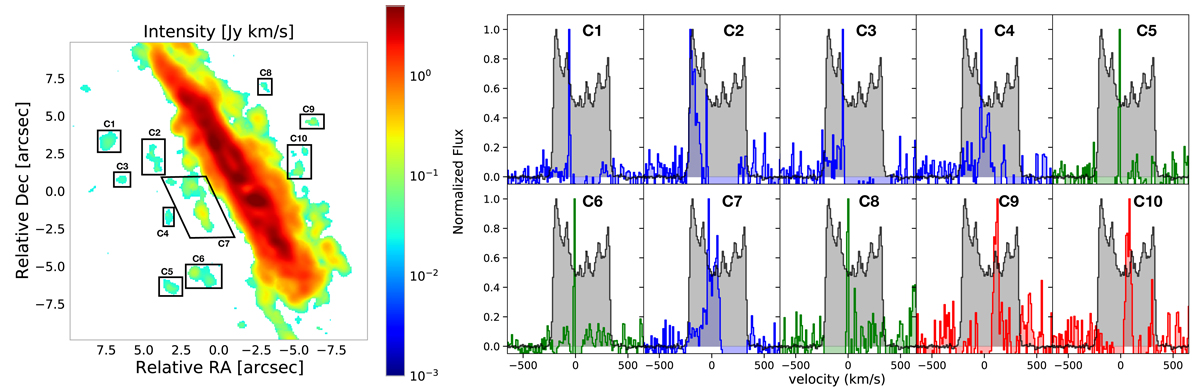
Fig. 6.
Download original image
Outflowing CO(2−1) clumps. Left panel: CO(2−1) intensity map with a cut at > 3σ. The labelled black polygons show the CO(2−1) clumps identified as cold molecular wind, i.e. not participating in the disc rotation. Right panel: blue, green, and red spectra are extracted from each molecular clump identified in the left panel, as labelled. Spectra are coloured according to the velocity shift of their peak: red with vpeak > 10 km s−1, green with −10 < vpeak < 10 km s−1, blue with vpeak < −10 km s−1. The grey-shaded histograms show the total CO(2−1) emission above a 3σ threshold extracted from the data-cube of coarser resolution.
Current usage metrics show cumulative count of Article Views (full-text article views including HTML views, PDF and ePub downloads, according to the available data) and Abstracts Views on Vision4Press platform.
Data correspond to usage on the plateform after 2015. The current usage metrics is available 48-96 hours after online publication and is updated daily on week days.
Initial download of the metrics may take a while.