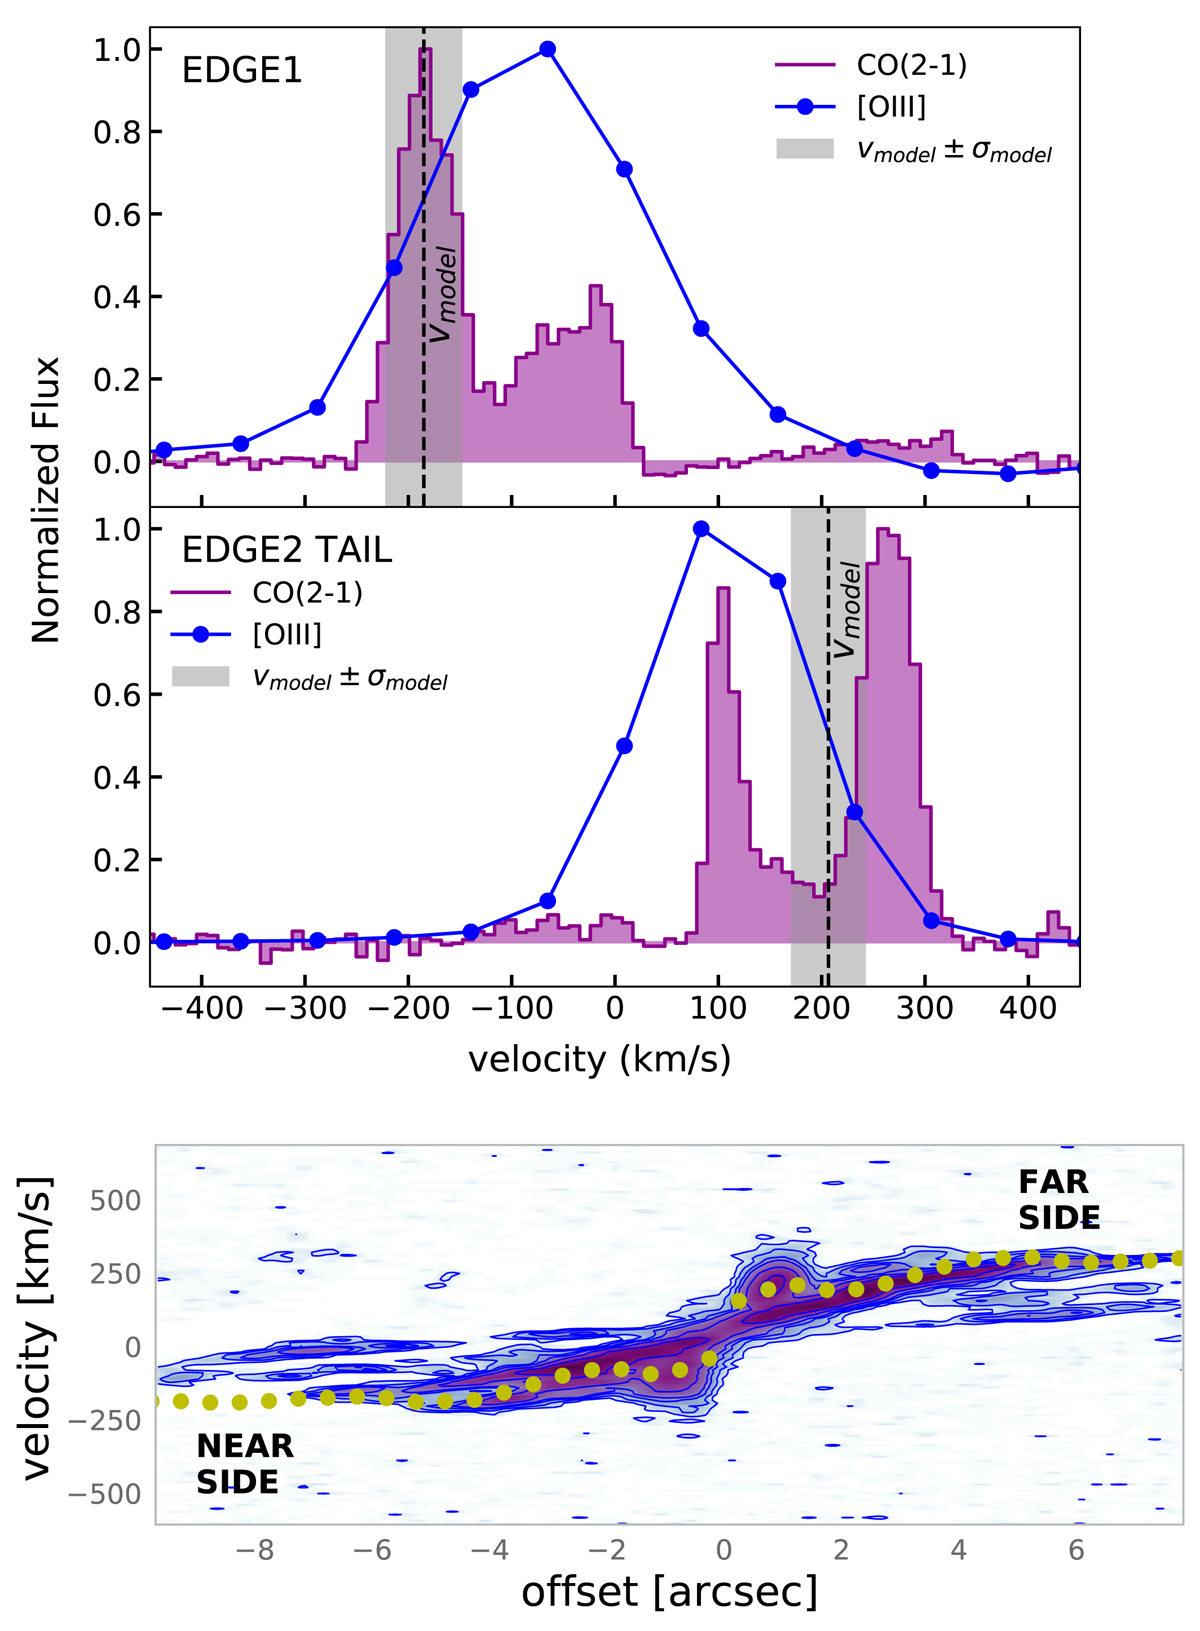
Fig. 5.
Download original image
EDGE1 and EDGE2 TAIL kinematics. Normalised CO(2−1) and [O III] spectra at the EDGE1 (upper panel) and EDGE2 TAIL (middle panel) regions. Purple histograms = CO(2−1) line. Blue symbols and solid line = [O III]. The dashed black line and grey shaded area represent the LOS velocity of the best-fit disc model and the [vmodel − σmodel, vmodel + σmodel] range, where (vmodel, σmodel) are (−185, 37) km s−1 and (206, 36) km s−1 at EDGE1 and EDGE2 TAIL, respectively. Bottom panel: CO(2−1) position–velocity plot (from 2017.1.01439.S) cut through EDGE1, EDGE2 TAIL, and the disc centre (along PA = 193 deg). The slit width is set to 0.6 arcsec (equal to the FWHM size of the synthetic beam major axis). Yellow symbols represent the disc model, while blue contours represent the data, with contours drawn at (2, 5, 10, 15, 30, 60)σ.
Current usage metrics show cumulative count of Article Views (full-text article views including HTML views, PDF and ePub downloads, according to the available data) and Abstracts Views on Vision4Press platform.
Data correspond to usage on the plateform after 2015. The current usage metrics is available 48-96 hours after online publication and is updated daily on week days.
Initial download of the metrics may take a while.