Fig. 3.
Download original image
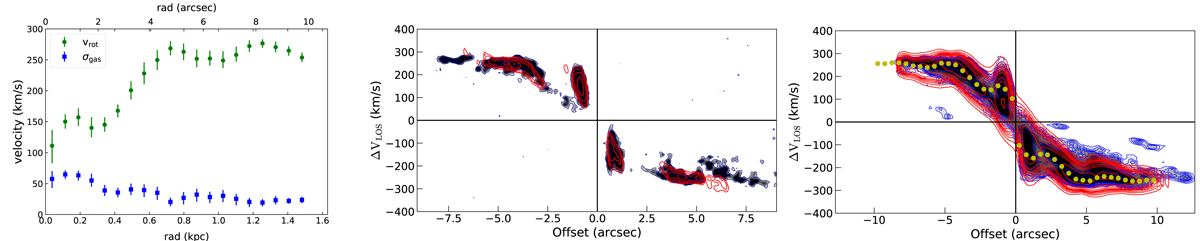
Cold molecular disc kinematics. Left panel: rotation velocity (green symbols) and velocity dispersion (blue symbols) as a function of the radius obtained from the best-fit disc dynamical model of the CO(2−1) data with 0.6 arcsec angular resolution. Middle and right panels: position–velocity diagrams along the kinematic major axis for the 0.2 arcsec and 0.6 arcsec resolution observations, respectively. The slit widths are set to the FWHM size of the synthetic beam major axis for each respective observation. Red contours and yellow circles represent the disc model, while blue contours represent the data. Contours are drawn at (1, 2, 4, 8, 16, 32, 64)σ.
Current usage metrics show cumulative count of Article Views (full-text article views including HTML views, PDF and ePub downloads, according to the available data) and Abstracts Views on Vision4Press platform.
Data correspond to usage on the plateform after 2015. The current usage metrics is available 48-96 hours after online publication and is updated daily on week days.
Initial download of the metrics may take a while.