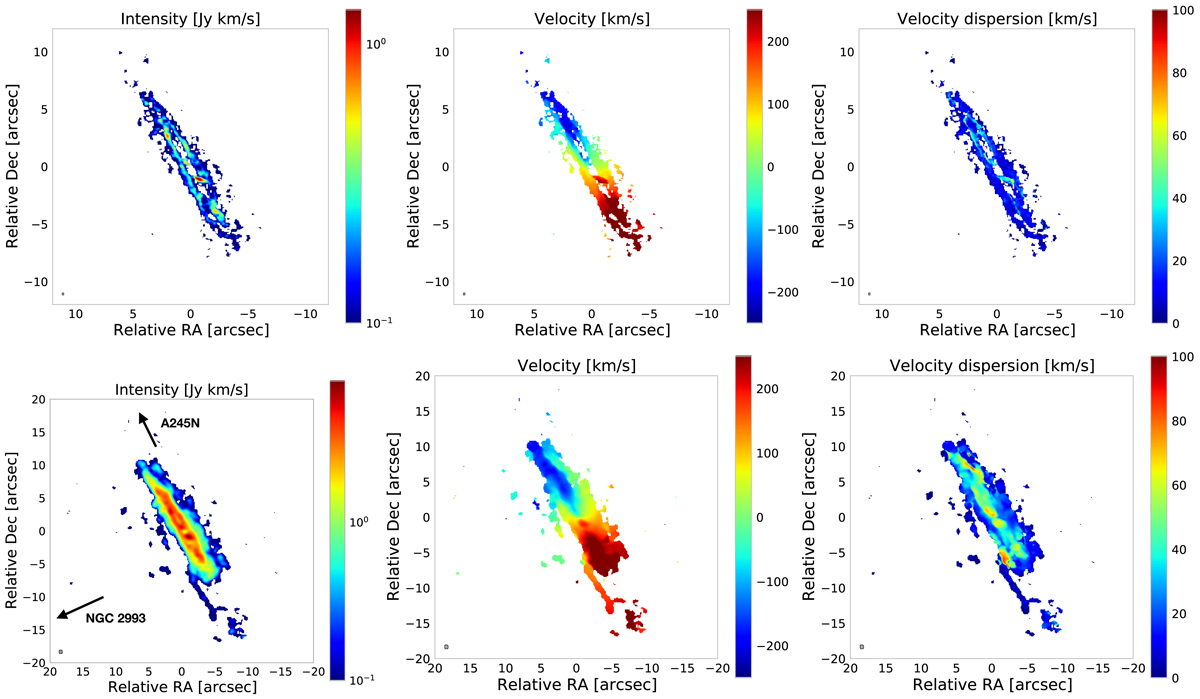
Fig. 2.
Download original image
ALMA moment maps. From left to right: CO(2−1) integrated flux (moment-0), mean velocity (moment-1), and velocity dispersion maps (moment-2). Top panels show data with 0.2 arcsec angular resolution, while the lower panels show data with 0.6 arcsec resolution. Regions with emission below 3σ are blanked out. The synthesised beam of each dataset is shown by the grey filled ellipses in the lower-left corner of the map. In the bottom-left panel, arrows indicate the direction towards NGC 2993 and Arp 245 North.
Current usage metrics show cumulative count of Article Views (full-text article views including HTML views, PDF and ePub downloads, according to the available data) and Abstracts Views on Vision4Press platform.
Data correspond to usage on the plateform after 2015. The current usage metrics is available 48-96 hours after online publication and is updated daily on week days.
Initial download of the metrics may take a while.