Open Access
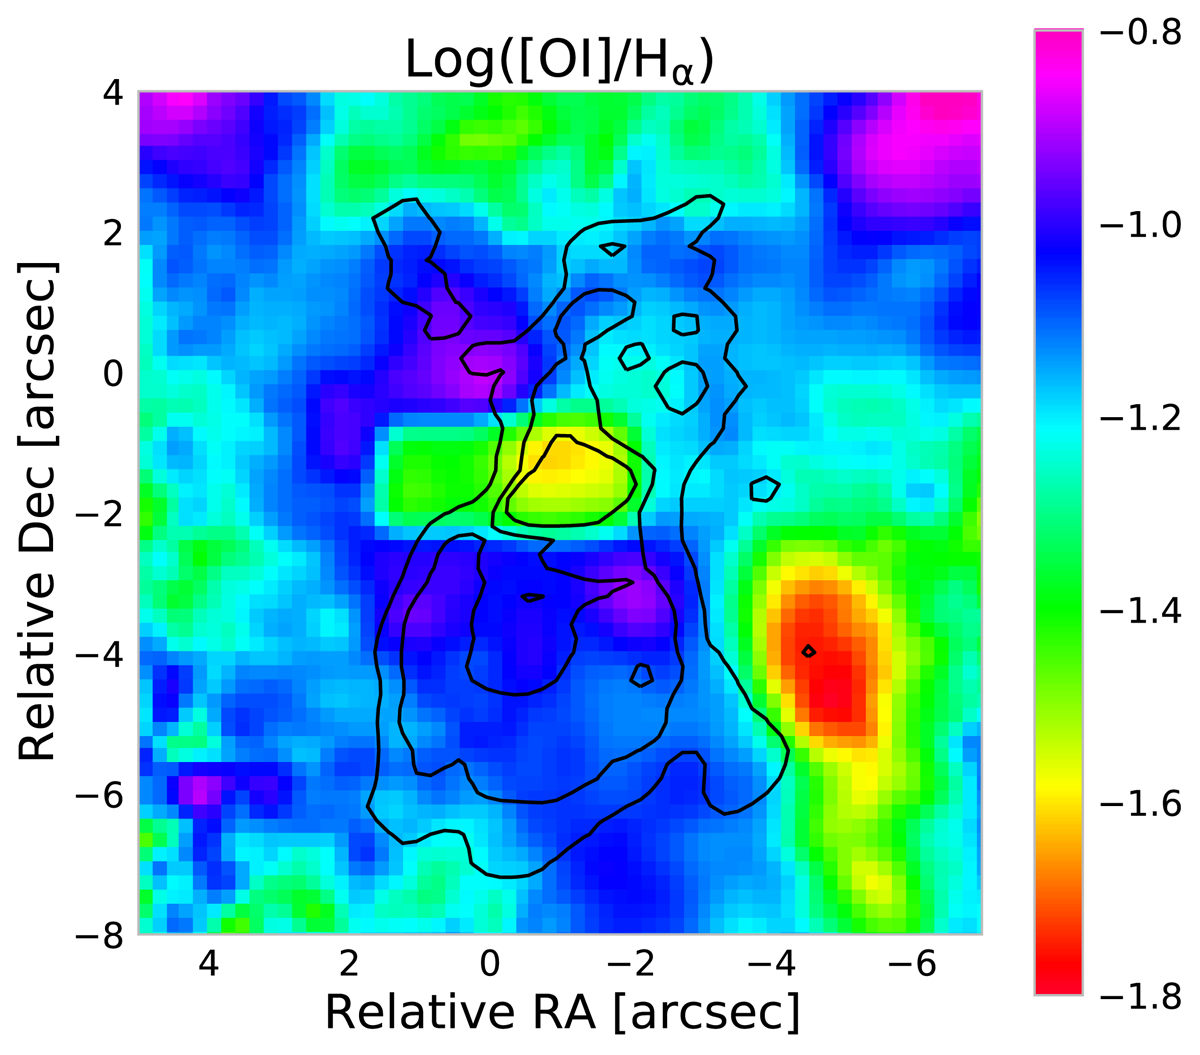
Fig. C.1.
Download original image
Map of the [O I]λ6003 Å/Hα ratio in log scale. Black contours are from EVLA radio continuum map at 6cm (Figure 1 left panel), drawn at (1, 5, 10)σ.
Current usage metrics show cumulative count of Article Views (full-text article views including HTML views, PDF and ePub downloads, according to the available data) and Abstracts Views on Vision4Press platform.
Data correspond to usage on the plateform after 2015. The current usage metrics is available 48-96 hours after online publication and is updated daily on week days.
Initial download of the metrics may take a while.