Fig. A.2.
Download original image
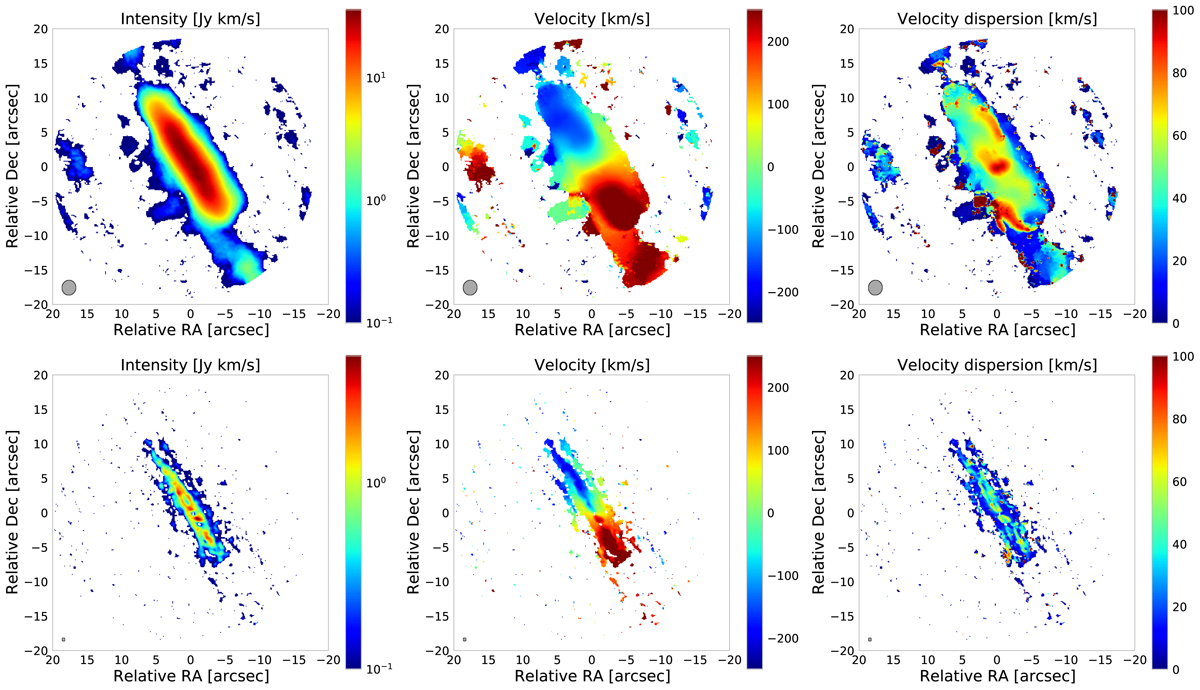
ALMA moment maps. ALMA first three moment maps obtained from the 2017.1.01439.S data-set selecting the baselines in order to separate the CO(2-1) emission over extended (top panels) and compact angular scales (bottom panels). From left to right: Integrated flux (moment-0), mean velocity (moment-1), and velocity dispersion (moment-2). The grey ellipses in lower-left corner show the synthesised beam size (i.e. the angular resolution): 2.18 × 2.03 arcsec2 at PA = -82 deg and 0.52 × 0.45 arcsec2 at PA = 81 deg (top and bottom panels respectively).
Current usage metrics show cumulative count of Article Views (full-text article views including HTML views, PDF and ePub downloads, according to the available data) and Abstracts Views on Vision4Press platform.
Data correspond to usage on the plateform after 2015. The current usage metrics is available 48-96 hours after online publication and is updated daily on week days.
Initial download of the metrics may take a while.