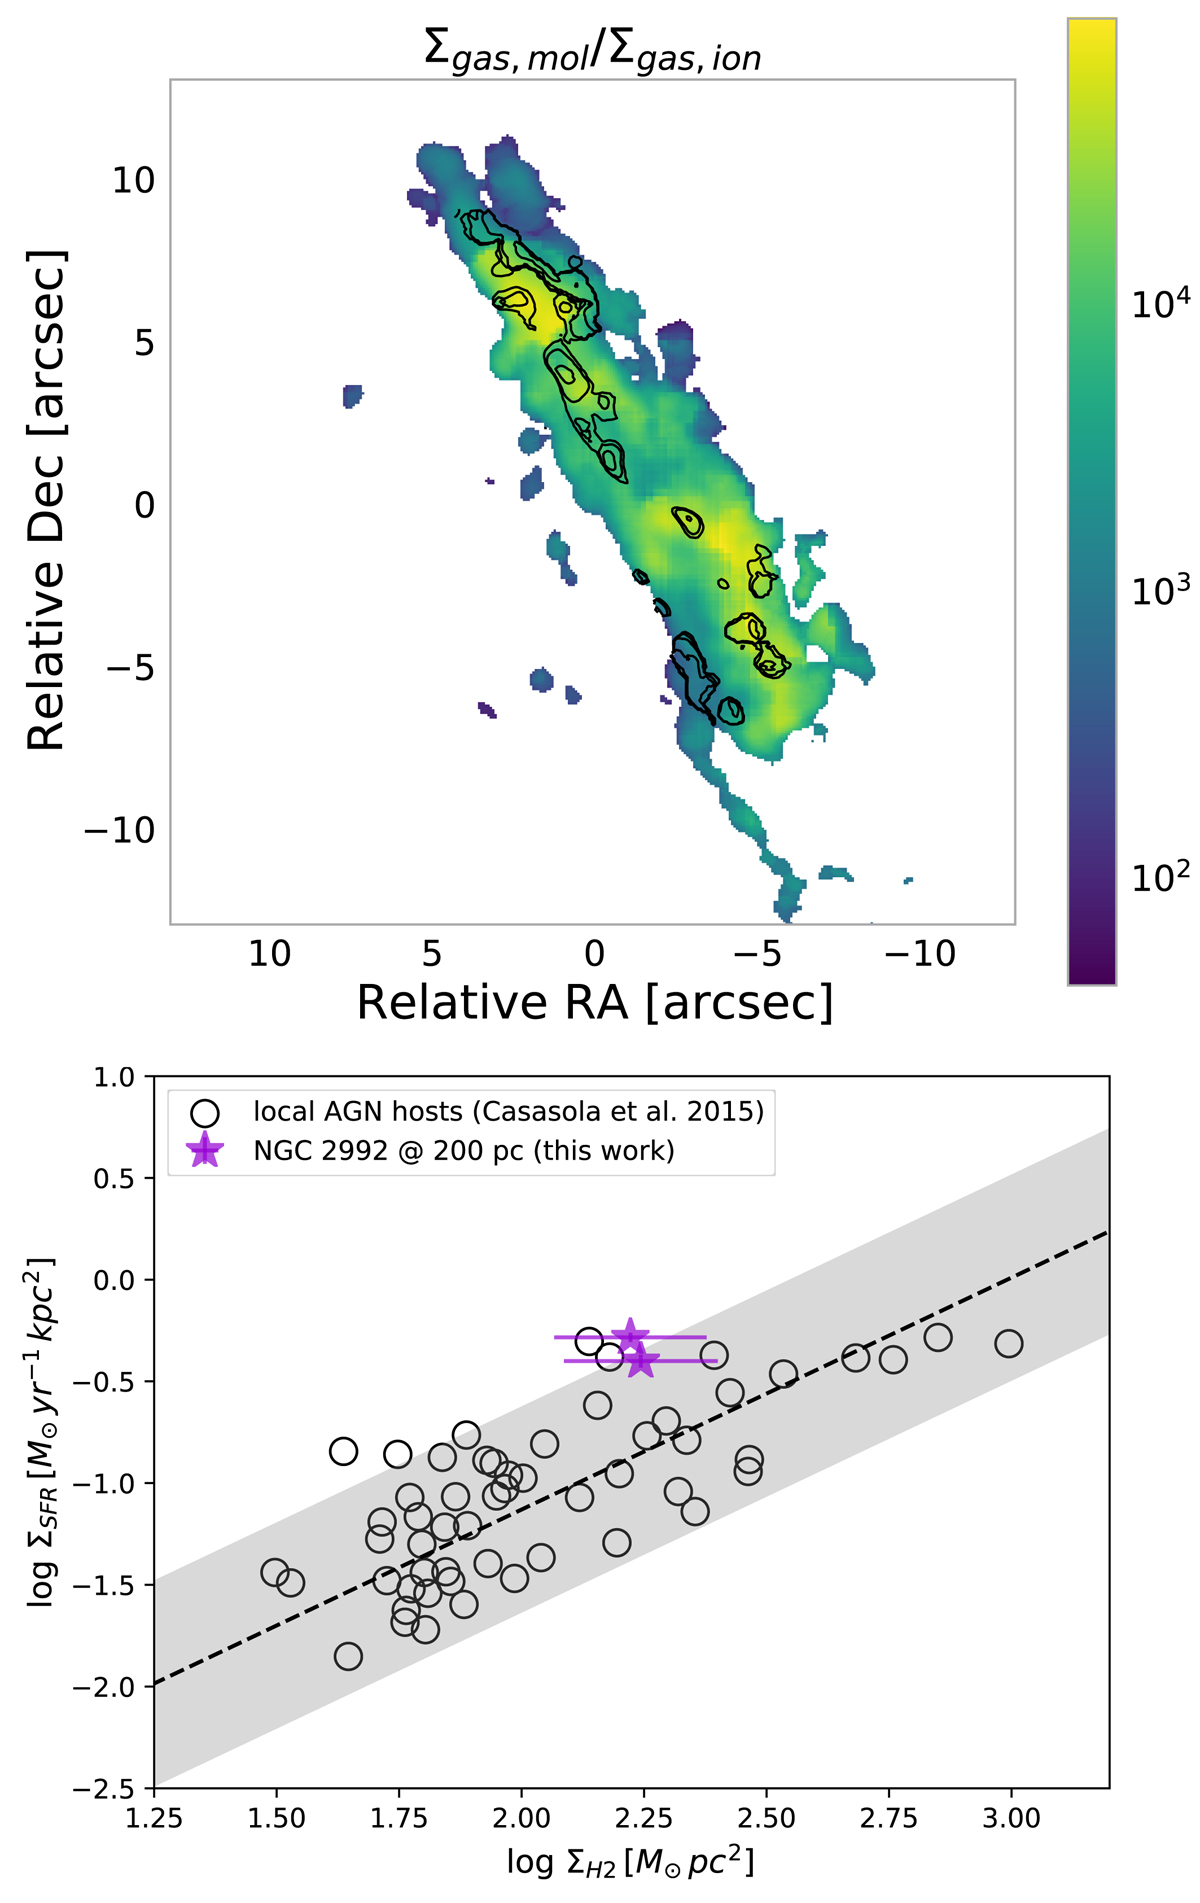
Fig. 13.
Download original image
Star formation across the disc of NGC 2992. Upper panel: map of the cold molecular to ionised ([O III]) gas surface densities ratio. The CO map has been degraded to the same angular resolution of the [O III] map. Black contours are from the residual velocity dispersion map (right panel Fig. 4) and are drawn at (5, 10, 20, 40) km s−1. Bottom panel: spatially resolved star-formation law on scales of ∼200 pc. Purple symbols are the two sides of the disc where radio continuum is detected (this work). Black symbols are data derived for local AGN host galaxies, along with their best-fit relation (dashed line) and dispersion (shaded area) from Casasola et al. (2015).
Current usage metrics show cumulative count of Article Views (full-text article views including HTML views, PDF and ePub downloads, according to the available data) and Abstracts Views on Vision4Press platform.
Data correspond to usage on the plateform after 2015. The current usage metrics is available 48-96 hours after online publication and is updated daily on week days.
Initial download of the metrics may take a while.