Fig. 11.
Download original image
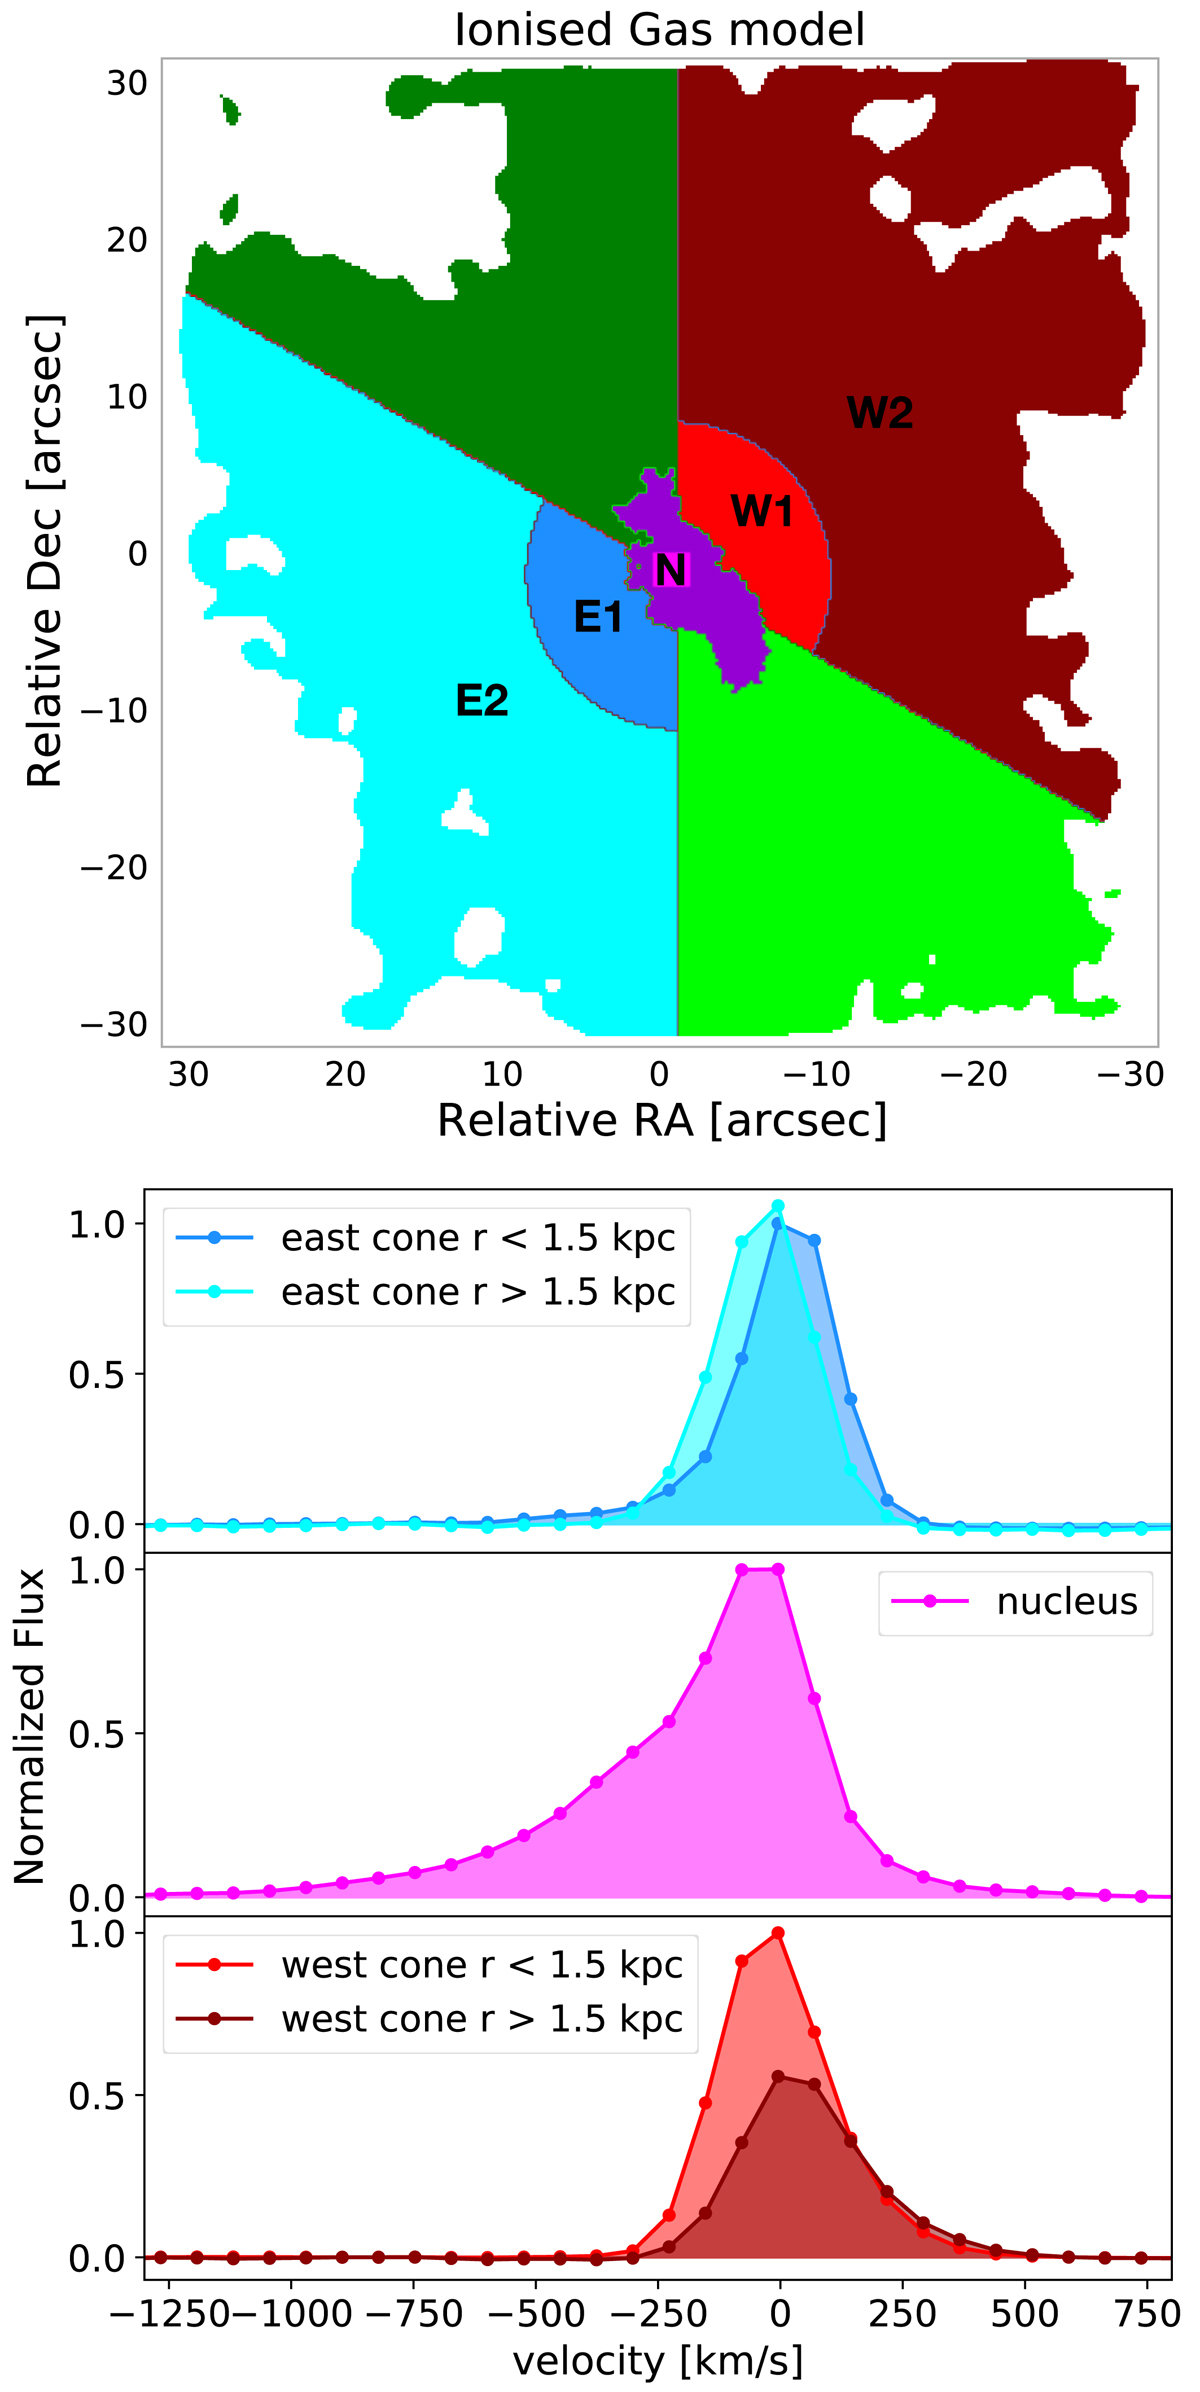
Ionised gas disc and wind kinematics. Top panel: simplified model of the source based on the ionised gas kinematics. Magenta = nucleus (N), purple = inner disc, Light/dark green: outer disc, red/burgundy = west ionisation cone (W1/W2), blue/cyan = east ionisation cone (E1/E2). Bottom panel: normalised [O III] line profiles at the wind regions, spectra are coloured according to the model map in the left panel.
Current usage metrics show cumulative count of Article Views (full-text article views including HTML views, PDF and ePub downloads, according to the available data) and Abstracts Views on Vision4Press platform.
Data correspond to usage on the plateform after 2015. The current usage metrics is available 48-96 hours after online publication and is updated daily on week days.
Initial download of the metrics may take a while.