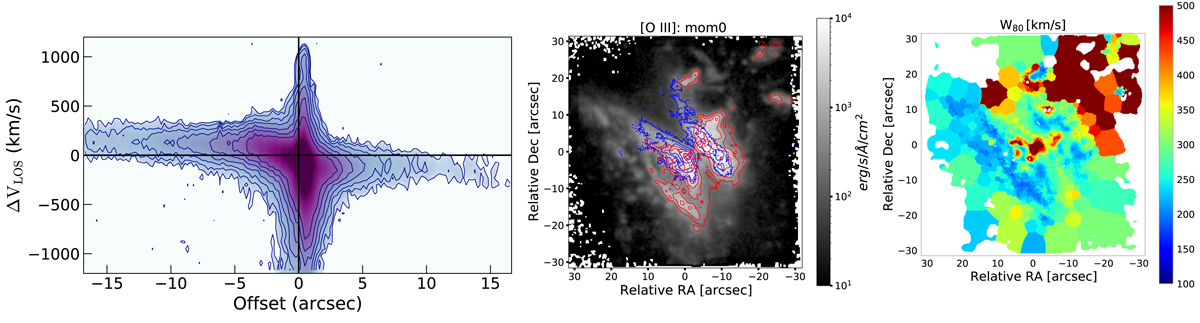
Fig. 10.
Download original image
Ionised gas kinematics traced with the [O III] emission line. Left panel: position–velocity diagram of the [O III] emission along the kinematic major axis, PA = 210 deg. Central panel: [O III] intensity map (grey scale), red and blue contours show the high-velocity [O III] emission between [200, 1000] and [−1000, −200] km s−1, respectively. Right panel: map of the W80 of the [O III] line.
Current usage metrics show cumulative count of Article Views (full-text article views including HTML views, PDF and ePub downloads, according to the available data) and Abstracts Views on Vision4Press platform.
Data correspond to usage on the plateform after 2015. The current usage metrics is available 48-96 hours after online publication and is updated daily on week days.
Initial download of the metrics may take a while.