Fig. 1.
Download original image
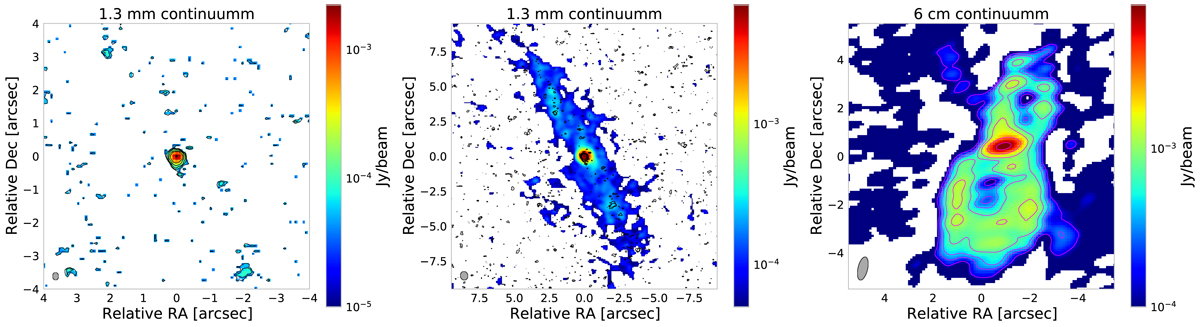
Radio continuum emission maps. Left panel: map of the 1.3 mm continuum emission at ∼0.2 arcsec resolution with a cut-out at 2σ. Contours are drawn at (2, 3, 6, 15, 60)σ, σ = 0.02 mJy beam−1. Central panel: ALMA map of the 1.3 mm continuum seen at ∼0.6 arcsec resolution with a cut-out at 1σ, σ = 0.05 mJy beam−1. Compared to the left panel, in this map both the nuclear emission and the dusty disc are detected. Contours as in left panel. Right panel: VLA 6 cm map of radio continuum. Contours are drawn at (1, 2, 3, 5, 8, 20, 50, 100)σ, σ = 0.14 mJy beam−1. The grey ellipses show the ALMA beam in the left and middle panels and the VLA beam in the right panel.
Current usage metrics show cumulative count of Article Views (full-text article views including HTML views, PDF and ePub downloads, according to the available data) and Abstracts Views on Vision4Press platform.
Data correspond to usage on the plateform after 2015. The current usage metrics is available 48-96 hours after online publication and is updated daily on week days.
Initial download of the metrics may take a while.