Fig. 9.
Download original image
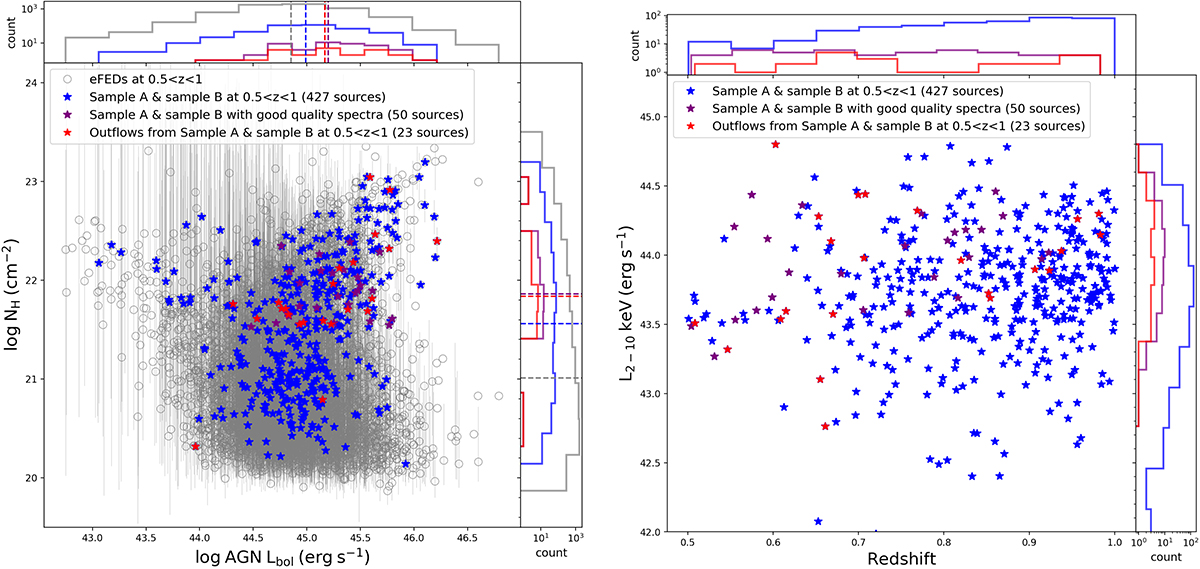
Comparisons of the different samples. Left panel: NH and AGN bolometric representation of our isolated candidates. Open grey circles represent eFEDS sources at 0.5 < z < 1, blue-filled stars represent sample A and sample B at 0.5 < z < 1, purple-filled stars represent sample A and sample B with good quality SDSS spectra and the red-filled stars represent the 23 candidates confirmed with outflows. The colours used in the histograms are identical to the colours used in the legend of the scatter plot for the same samples. The dotted lines represent the means of the respective distributions. Right panel: the X-ray luminosity and redshift distributions of three samples; sample A and sample B at 0.5 < z < 1, sample A and sample B with good quality SDSS spectra and 23 candidates confirmed with outflows. The colours used in the histograms are identical to the colours used in the legend of the scatter plot for the same samples.
Current usage metrics show cumulative count of Article Views (full-text article views including HTML views, PDF and ePub downloads, according to the available data) and Abstracts Views on Vision4Press platform.
Data correspond to usage on the plateform after 2015. The current usage metrics is available 48-96 hours after online publication and is updated daily on week days.
Initial download of the metrics may take a while.