Fig. 7.
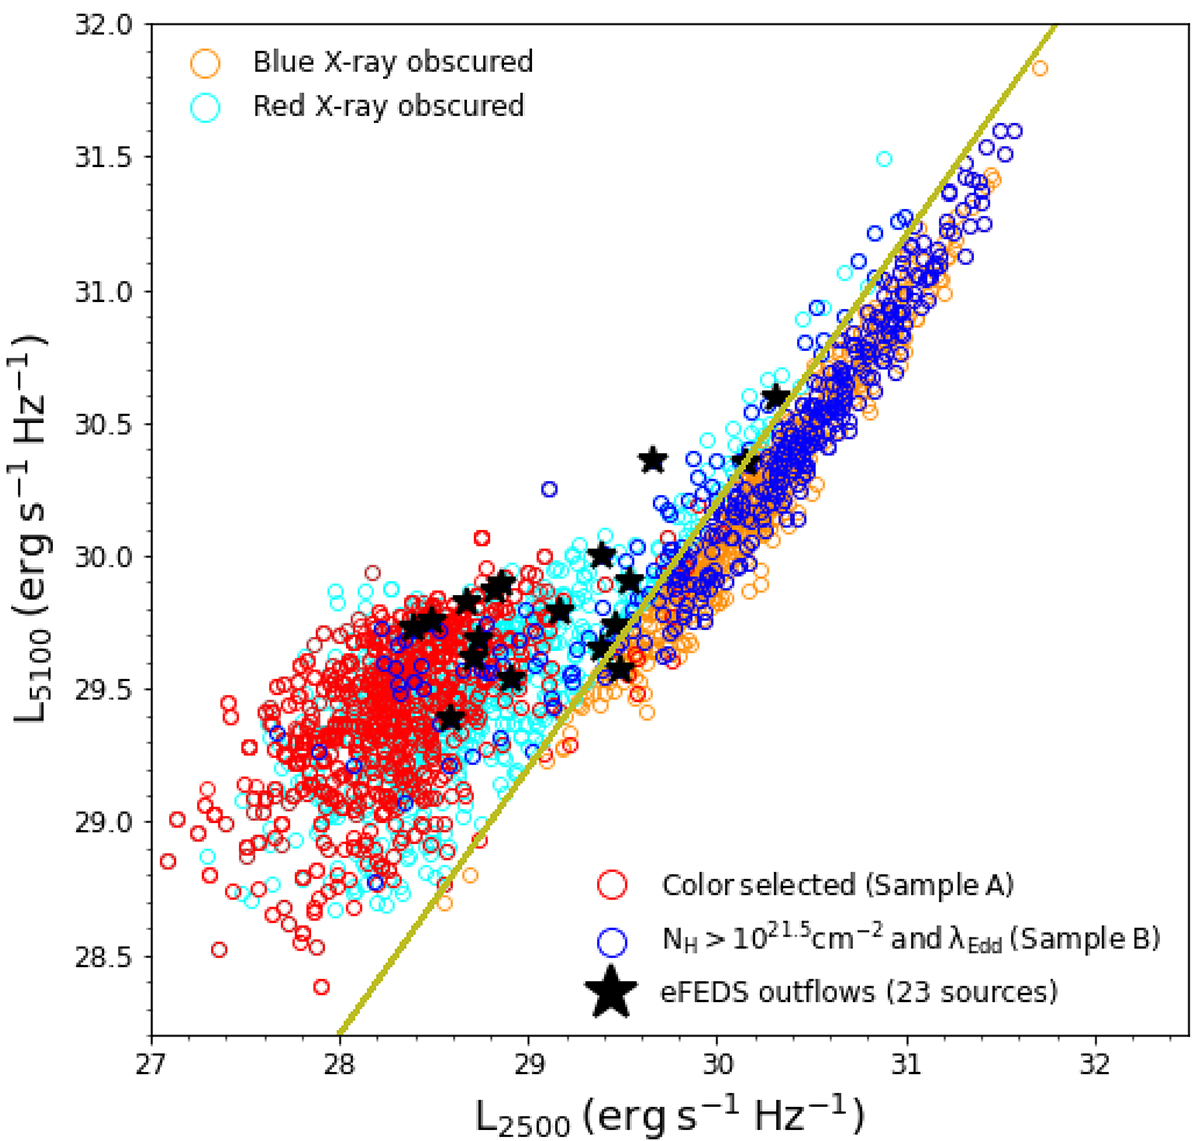
Download original image
Luminosity at 5100 Å (L5100 Å) versus Luminosity at 2500 Å (L2500 Å) for sources in Samples A and B. Representation of the selected samples with the X-ray obscured sources (NH > 1021.5 cm−2: red obscured and blue obscured based on the line L5100 Å − L2500 Å = 0.2; see text for details). Candidates in sample B appear in the blue side (selects mostly type 1 AGN). It also correlates well with L5100 Å − L2500 Å = 0.2 relation which indicates their type 1 nature. Sample A indeed appear in the red side (selects mostly type 2 AGN). We indicate in black stars the 23 ionised outflows from the eFEDS sample (see Sect. 3.2 for the discussion of these 23 sources).
Current usage metrics show cumulative count of Article Views (full-text article views including HTML views, PDF and ePub downloads, according to the available data) and Abstracts Views on Vision4Press platform.
Data correspond to usage on the plateform after 2015. The current usage metrics is available 48-96 hours after online publication and is updated daily on week days.
Initial download of the metrics may take a while.