Open Access
Fig. 5.
Download original image
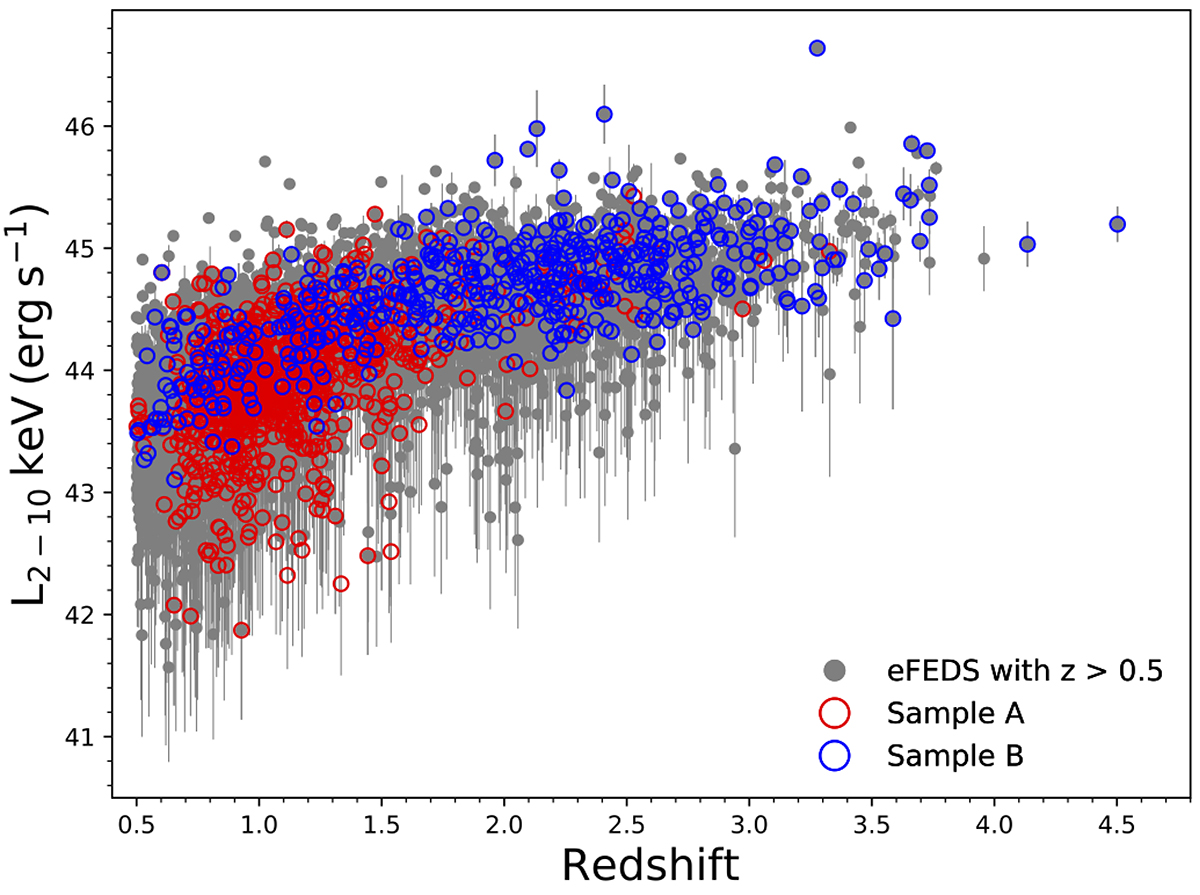
X-ray luminosity and redshift distributions of our two main candidate samples. The grey points indicate the eFEDS AGN sample at z > 0.5. The red circles indicate sample A obtained after applying the colour selections described in Sect. 2.2 while blue circles indicate Sample B selected as detailed in Sect. 2.3.
Current usage metrics show cumulative count of Article Views (full-text article views including HTML views, PDF and ePub downloads, according to the available data) and Abstracts Views on Vision4Press platform.
Data correspond to usage on the plateform after 2015. The current usage metrics is available 48-96 hours after online publication and is updated daily on week days.
Initial download of the metrics may take a while.