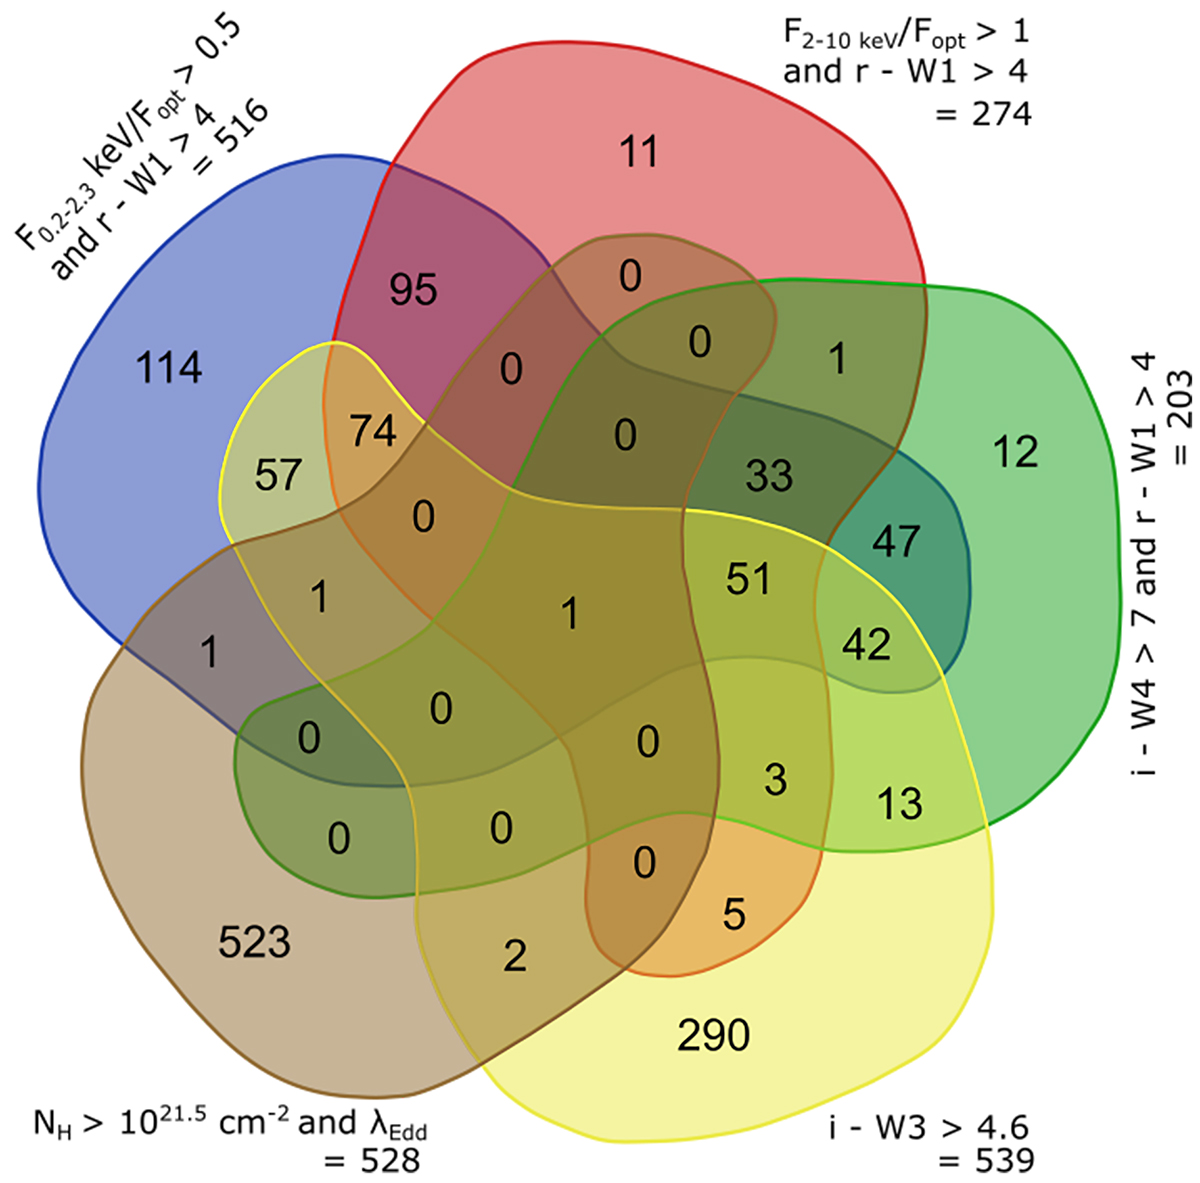
Fig. 4.
Download original image
Venn diagram showing how many sources overlap from our selection criteria. The source that is common in all the four selection method is ID 608 (Brusa et al. 2022). Fopt refers to flux in the optical r-band. The selection methods are indicated by different colours. The Venn diagram was drawn using bioinformatics and evolutionary genomics webtool at https://bioinformatics.psb.ugent.be/webtools/Venn/.
Current usage metrics show cumulative count of Article Views (full-text article views including HTML views, PDF and ePub downloads, according to the available data) and Abstracts Views on Vision4Press platform.
Data correspond to usage on the plateform after 2015. The current usage metrics is available 48-96 hours after online publication and is updated daily on week days.
Initial download of the metrics may take a while.