Fig. 3.
Download original image
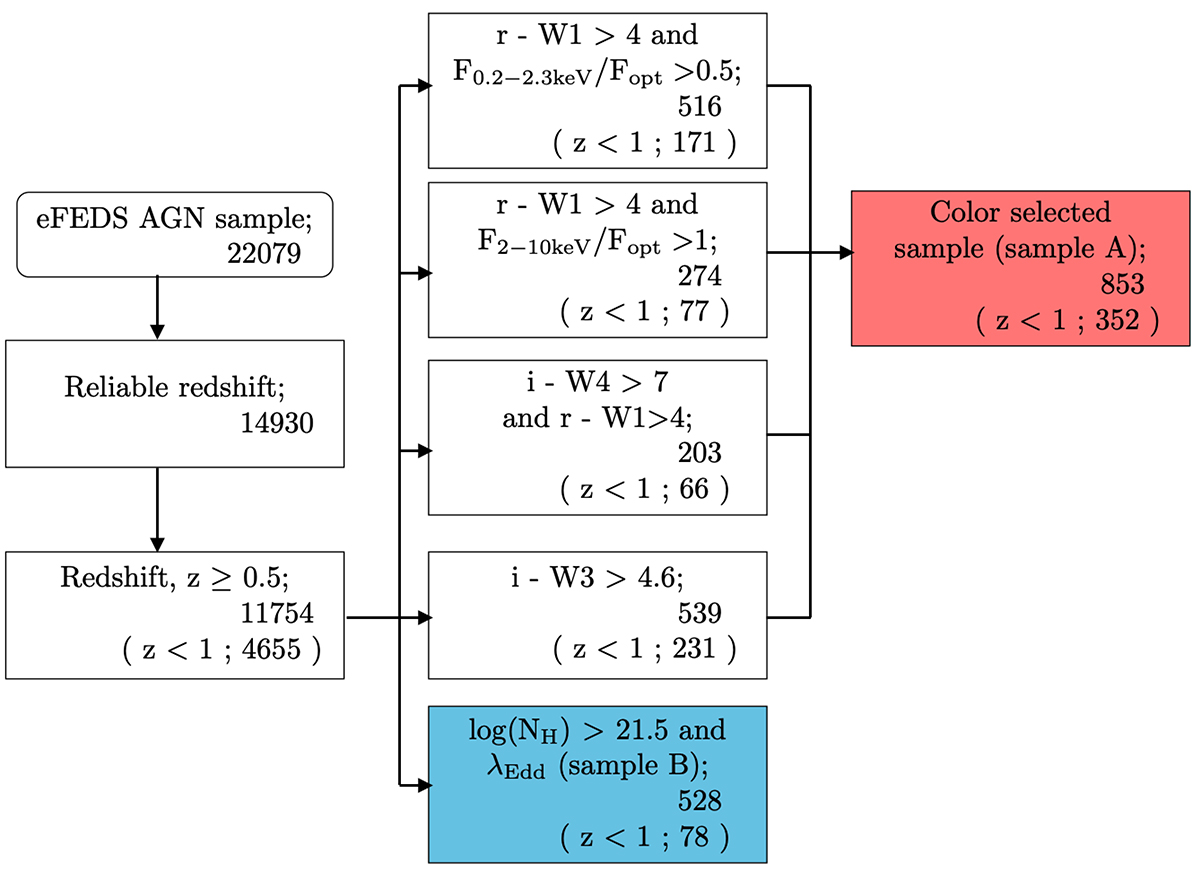
Flow chart summarising our selection criteria used to isolate candidates from the eFEDS AGN sample. Each box contains a selection method with the cuts applied and the number of sources obtained in the bottom right corner of each box. In brackets, we indicate the number of sources for z less than one (0.5 < z < 1) which we apply later on for SDSS spectra analysis. By reliable spectroscopic or photometric redshift, we only consider redshift grade 4 or 5 – see Salvato et al. (2022). Fopt refers to flux in the optical r-band. The box highlighted in red is sample A obtained after applying the colour selections in the top right of Fig. 1. The box highlighted in blue is the NH > 1021.5 cm−2 and ![]() selection or sample B in Fig. 2.
selection or sample B in Fig. 2.
Current usage metrics show cumulative count of Article Views (full-text article views including HTML views, PDF and ePub downloads, according to the available data) and Abstracts Views on Vision4Press platform.
Data correspond to usage on the plateform after 2015. The current usage metrics is available 48-96 hours after online publication and is updated daily on week days.
Initial download of the metrics may take a while.