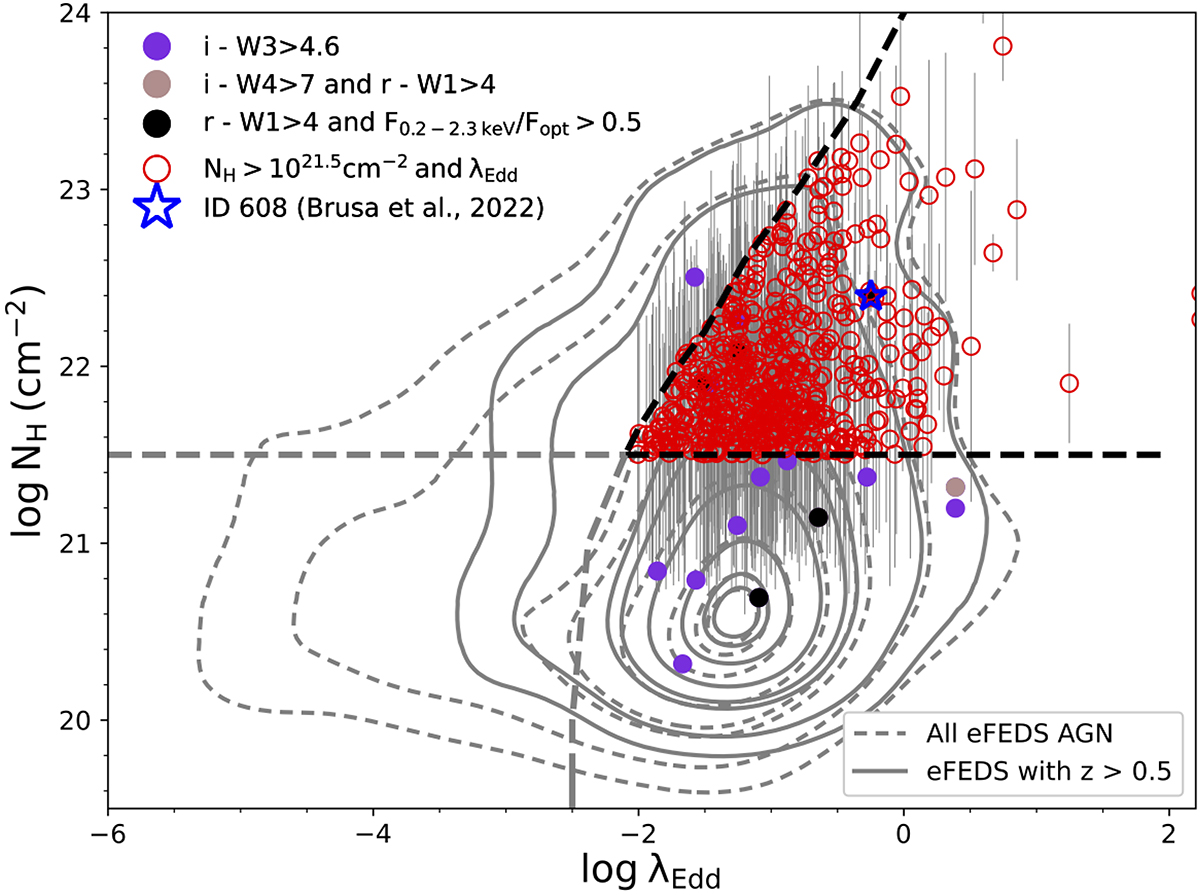
Fig. 2.
Download original image
NH plotted against Eddington ratio. Sources marked in red are the selected candidates. Solid grey contours are eFEDS sample after applying the cut on redshift (z > 0.5) and dashed grey contours show the full eFEDS sample. ID 608 (Brusa et al. 2022; blue star) and the sources isolated from Sect. 2.2 are shown with violet circles. The black thick dashed line and curve represent the region NH > 1021.5 cm−2 and λEdd > effective Eddington limit. The dotted curve (thick and thin) is the effective Eddington limit for different values of NH (Fabian et al. 2009).
Current usage metrics show cumulative count of Article Views (full-text article views including HTML views, PDF and ePub downloads, according to the available data) and Abstracts Views on Vision4Press platform.
Data correspond to usage on the plateform after 2015. The current usage metrics is available 48-96 hours after online publication and is updated daily on week days.
Initial download of the metrics may take a while.