Fig. B.3.
Download original image
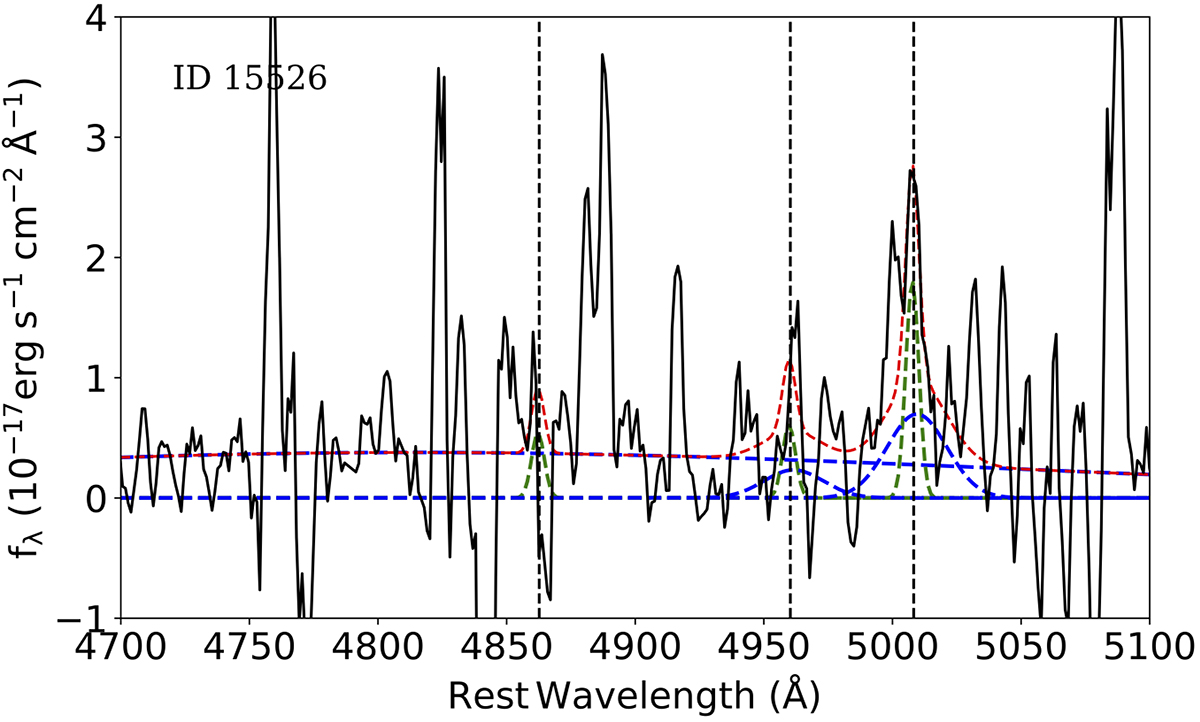
An example of the spectra that we classified as bad due to a very noisy continuum around the [OIII] region or bad residuals after the continuum and host galaxy subtraction. The red line indicates the total fit. The vertical dotted lines indicate the peaks at 4862.68, 4960.30, and 5008.24 for Hβ and [OIII] rest-frame wavelength.
Current usage metrics show cumulative count of Article Views (full-text article views including HTML views, PDF and ePub downloads, according to the available data) and Abstracts Views on Vision4Press platform.
Data correspond to usage on the plateform after 2015. The current usage metrics is available 48-96 hours after online publication and is updated daily on week days.
Initial download of the metrics may take a while.