Fig. A.1.
Download original image
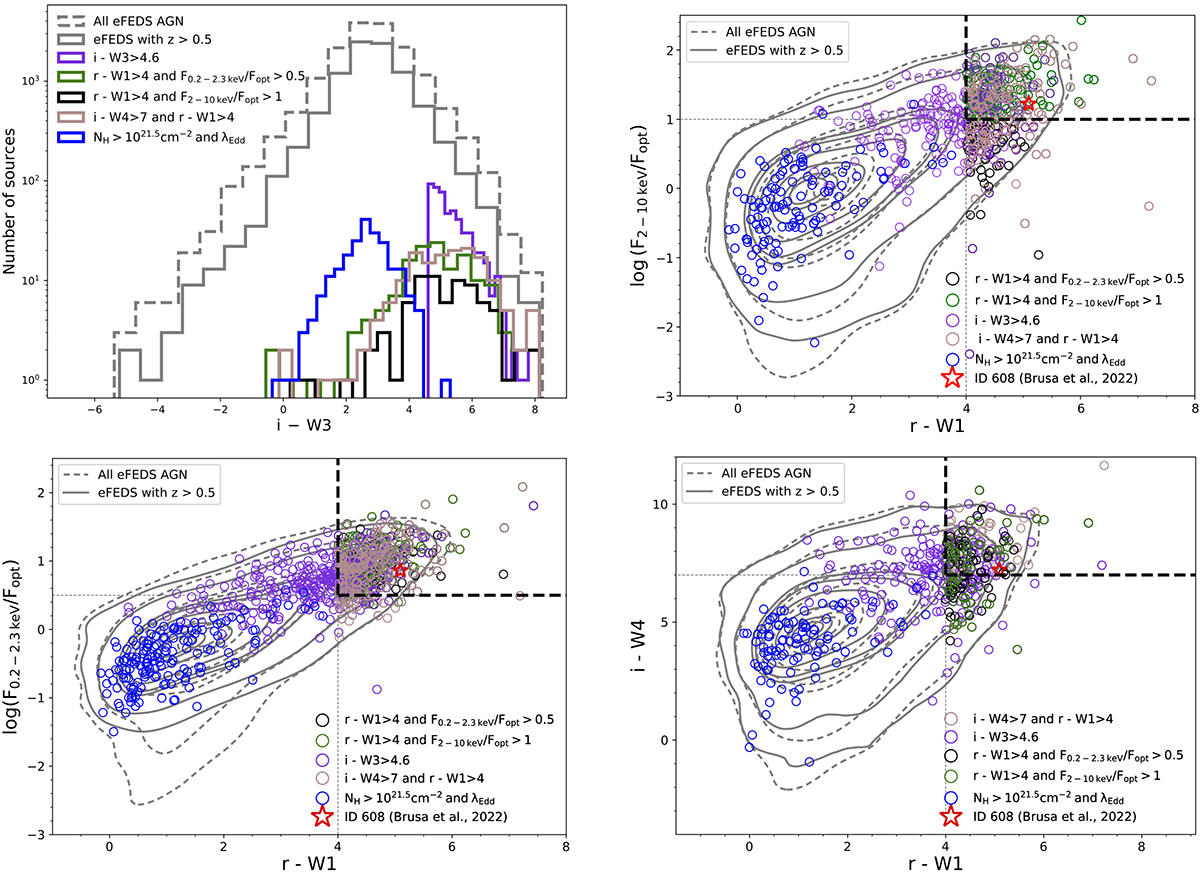
All selected candidates plotted in different planes. Top left panel: i-W3 distribution of candidates selected by different methods. Top right panel: Candidates selected by different methods plotted in 2 − 10 keV to optical flux ratio vs. r-W1 colour plane. Bottom left panel: 0.2 − 2.3 keV to optical flux ratio vs. r-W1 colour. The sources from different selection methods are indicated with different colours or shapes as shown in the legend. Bottom right panel: All selected candidates plotted in i-W4 vs. r-W1. The sources from different selection methods are indicated with different colours as shown in the legend.
Current usage metrics show cumulative count of Article Views (full-text article views including HTML views, PDF and ePub downloads, according to the available data) and Abstracts Views on Vision4Press platform.
Data correspond to usage on the plateform after 2015. The current usage metrics is available 48-96 hours after online publication and is updated daily on week days.
Initial download of the metrics may take a while.