Fig. 12.
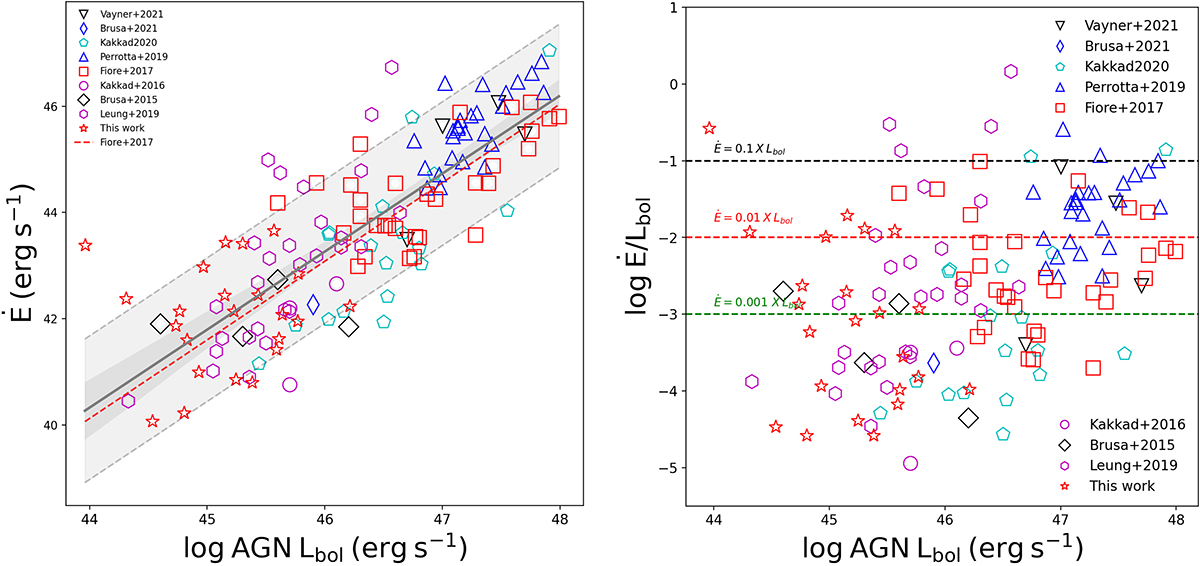
Download original image
Ionised kinetic power and kinetic coupling efficiency as a function of AGN bolometric luminosity. Left panel: ionised kinetic power as a function of AGN bolometric luminosity. The red dashed line is the best scaling relation obtained in Fiore et al. (2017). The solid grey line in both panels is our scaling relation obtained from OLS fitting between the two variables. The grey region indicates the 95% confidence interval and the faded filled region between two dashed black lines is the 1σ. Right panel: kinetic coupling efficiency (Ė/Lbol) versus AGN bolometric luminosity. The black dashed line represents Ė = 0.1 Lbol, red dashed line represents Ė = 0.01 Lbol and green dashed line represents Ė = 0.001 Lbol. 30% of the candidates appear above Ė/Lbol = 0.01 or 1%. These values have 2−3 orders of magnitude uncertainties due to the different assumptions applied.
Current usage metrics show cumulative count of Article Views (full-text article views including HTML views, PDF and ePub downloads, according to the available data) and Abstracts Views on Vision4Press platform.
Data correspond to usage on the plateform after 2015. The current usage metrics is available 48-96 hours after online publication and is updated daily on week days.
Initial download of the metrics may take a while.