Fig. 11.
Download original image
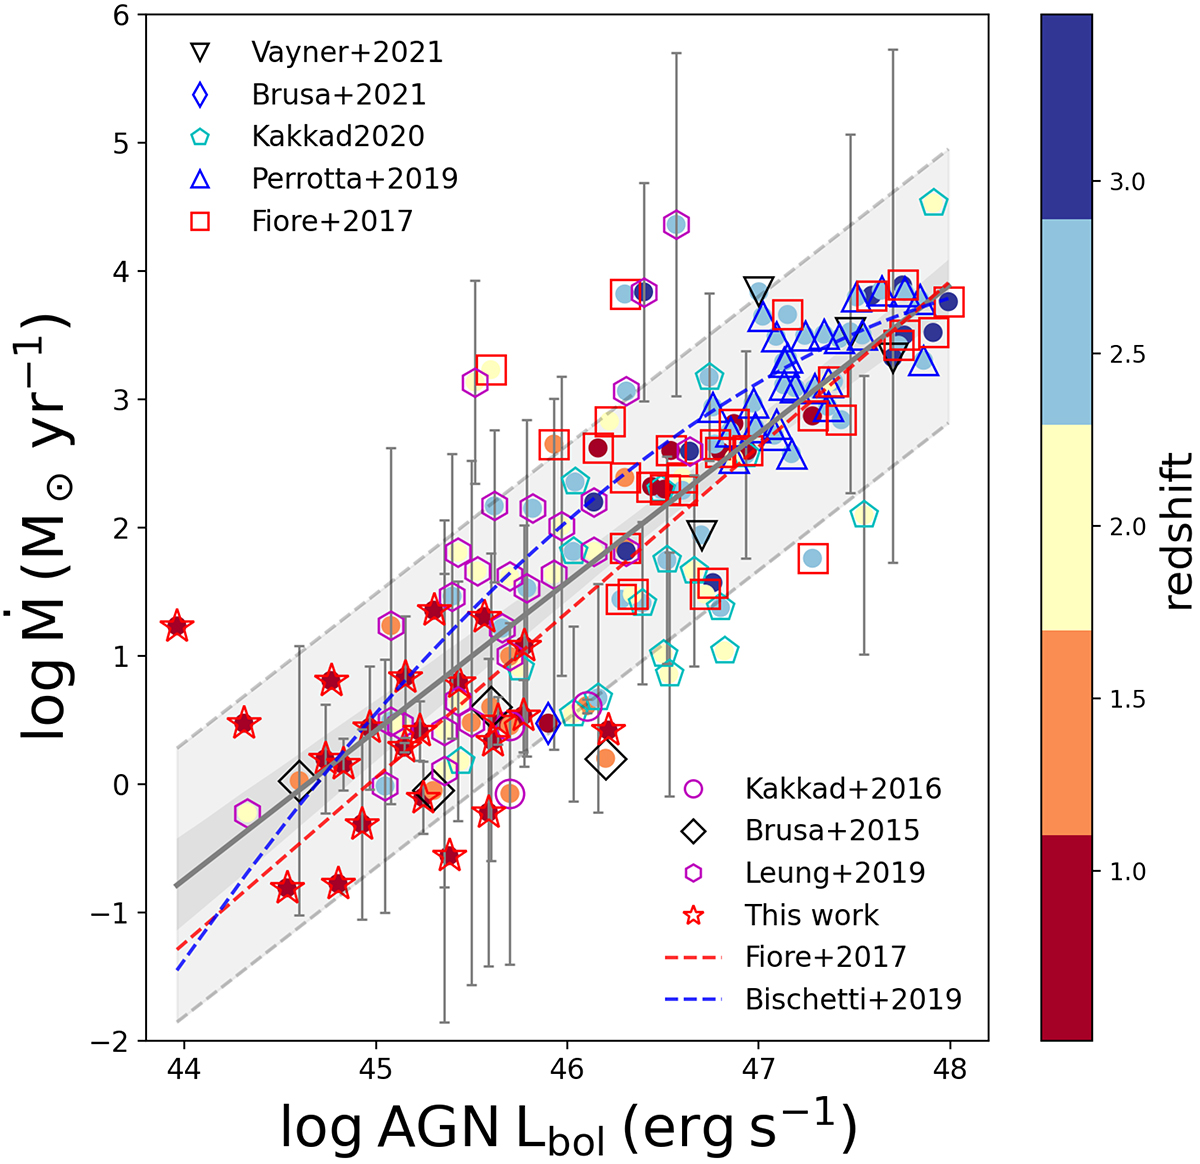
Ionised mass outflow rate as a function of AGN bolometric luminosity. Different shapes represent different literature samples (as labelled). The filled circles are colour-coded with redshift. The blue dashed line is the best-fit relation obtained for ionised outflows in Bischetti et al. (2019). The solid grey line is the scaling relation obtained in this work, from fitting between the two variables (see Table 2). The grey region indicates the 95% confidence interval and the shaded filled region between two dashed black lines is the 1σ. The red dashed line is the scaling relation from Fiore et al. (2017), obtained for a sample of ∼55 ionised outflows without imposing a redshift cut z > 0.5. The error bars on mass outflow rate values were obtained by extrapolating the errors on FWHM or δV whenever available. These values may have 2−3 orders of magnitude uncertainties due to the different assumptions applied.
Current usage metrics show cumulative count of Article Views (full-text article views including HTML views, PDF and ePub downloads, according to the available data) and Abstracts Views on Vision4Press platform.
Data correspond to usage on the plateform after 2015. The current usage metrics is available 48-96 hours after online publication and is updated daily on week days.
Initial download of the metrics may take a while.