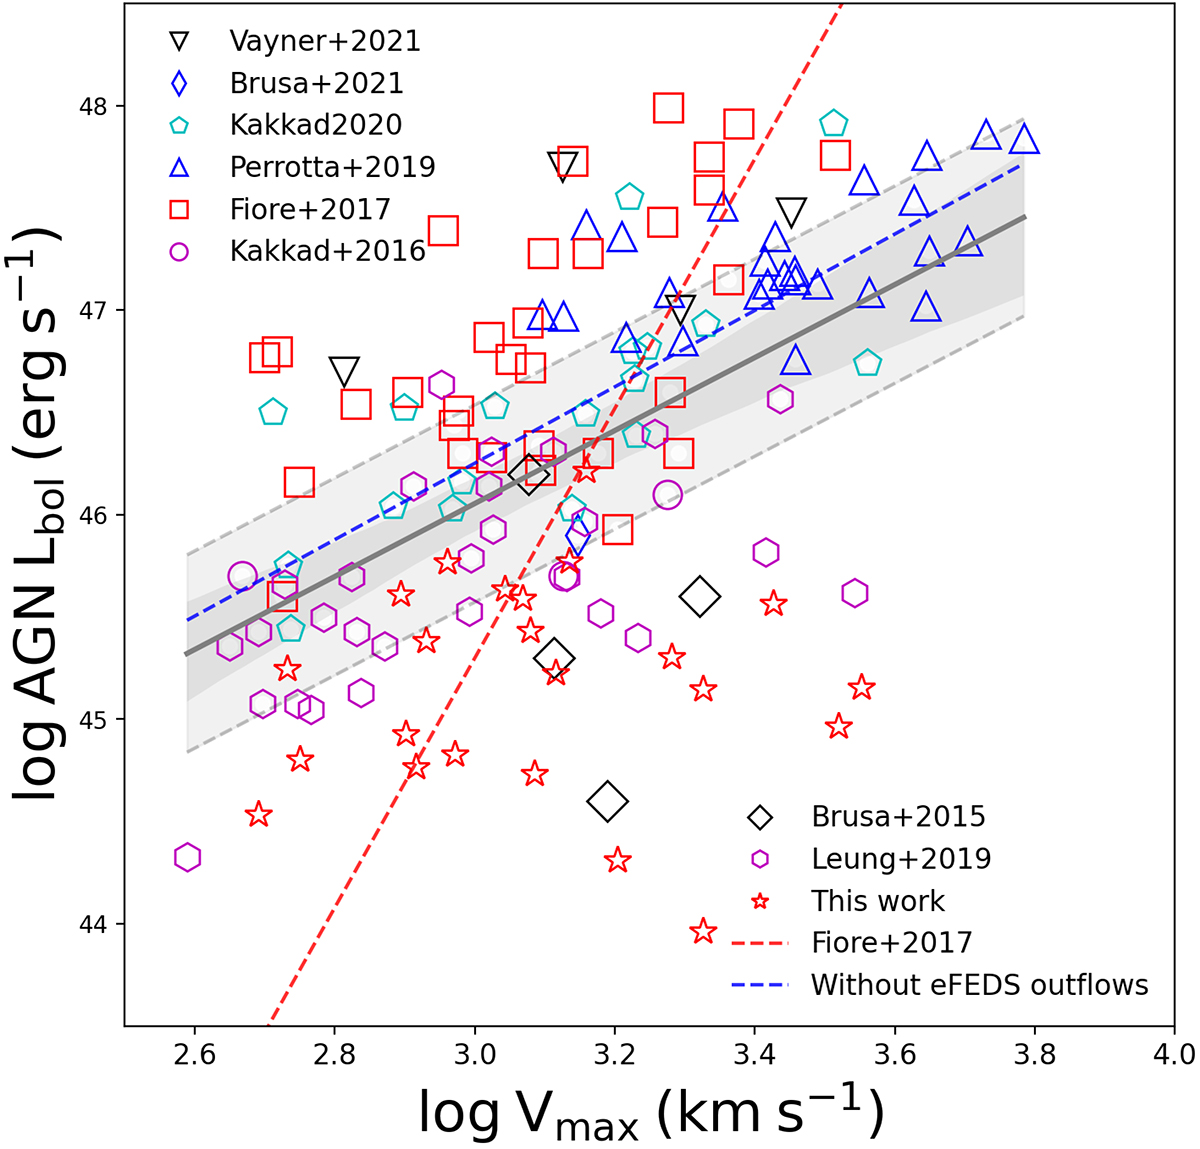
Fig. 10.
Download original image
AGN bolometric luminosity as a function of outflow velocity. Different shapes represent different samples from literature, as labelled. The solid grey line is the scaling relation obtained from fitting between the two variables including our AGN outflows from eFEDS (see Table 2). The grey region indicates the 95% confidence interval and the shaded filled region between two dashed black lines is the 1σ. The red dashed line is the scaling relation from Fiore et al. (2017), obtained for a sample of ∼55 ionised outflows without imposing a redshift cut z > 0.5. The blue dashed line is the scaling relation obtained from fitting the two variables excluding our eFEDS sources. The relation still appears flattish as compared to Fiore et al. (2017). It is important to note that we maintain the same legend for QWO and eFEDS sources in the following figures.
Current usage metrics show cumulative count of Article Views (full-text article views including HTML views, PDF and ePub downloads, according to the available data) and Abstracts Views on Vision4Press platform.
Data correspond to usage on the plateform after 2015. The current usage metrics is available 48-96 hours after online publication and is updated daily on week days.
Initial download of the metrics may take a while.