Fig. 1.
Download original image
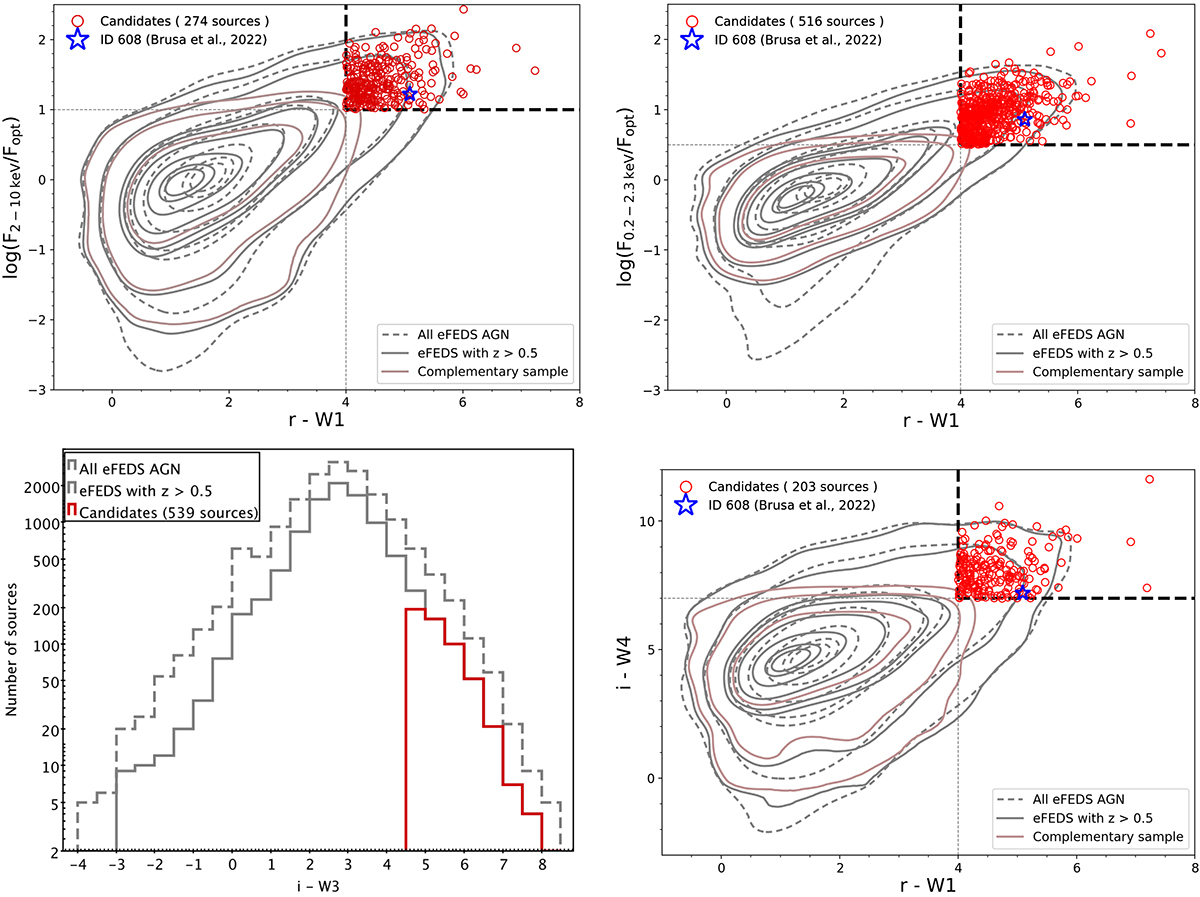
Colour selections to isolate AGNs in the feedback phase. Top left panel: the 2 − 10 keV to optical flux ratio versus r − W1 colour. The black thick dashed lines represent Eqs. (1) and (3) selection locus. Top right panel: the 0.2 − 2.3 keV to optical flux ratio versus r − W1 colour. The black thick dashed lines represent Eqs. (1) and (4) selection locus. Bottom left panel: distribution of i − W3 selected sample. Red distribution are selected candidates with Eq. (2). Bottom right panel: i − W4 versus r − W1 selection method. The black thick dashed lines represent the Eqs. (1) and (5) selection locus. In all panels, the red circles are the selected candidates. Brown contours are sources in the complementary locus. Solid grey contours or distribution indicate the eFEDS AGN sample after applying the cut on redshift (z > 0.5) and dashed grey contours or distribution show the full eFEDS AGN sample. XID 439 or ID 608 Brusa et al. (2022) is shown as a blue star.
Current usage metrics show cumulative count of Article Views (full-text article views including HTML views, PDF and ePub downloads, according to the available data) and Abstracts Views on Vision4Press platform.
Data correspond to usage on the plateform after 2015. The current usage metrics is available 48-96 hours after online publication and is updated daily on week days.
Initial download of the metrics may take a while.