Fig. 3
Download original image
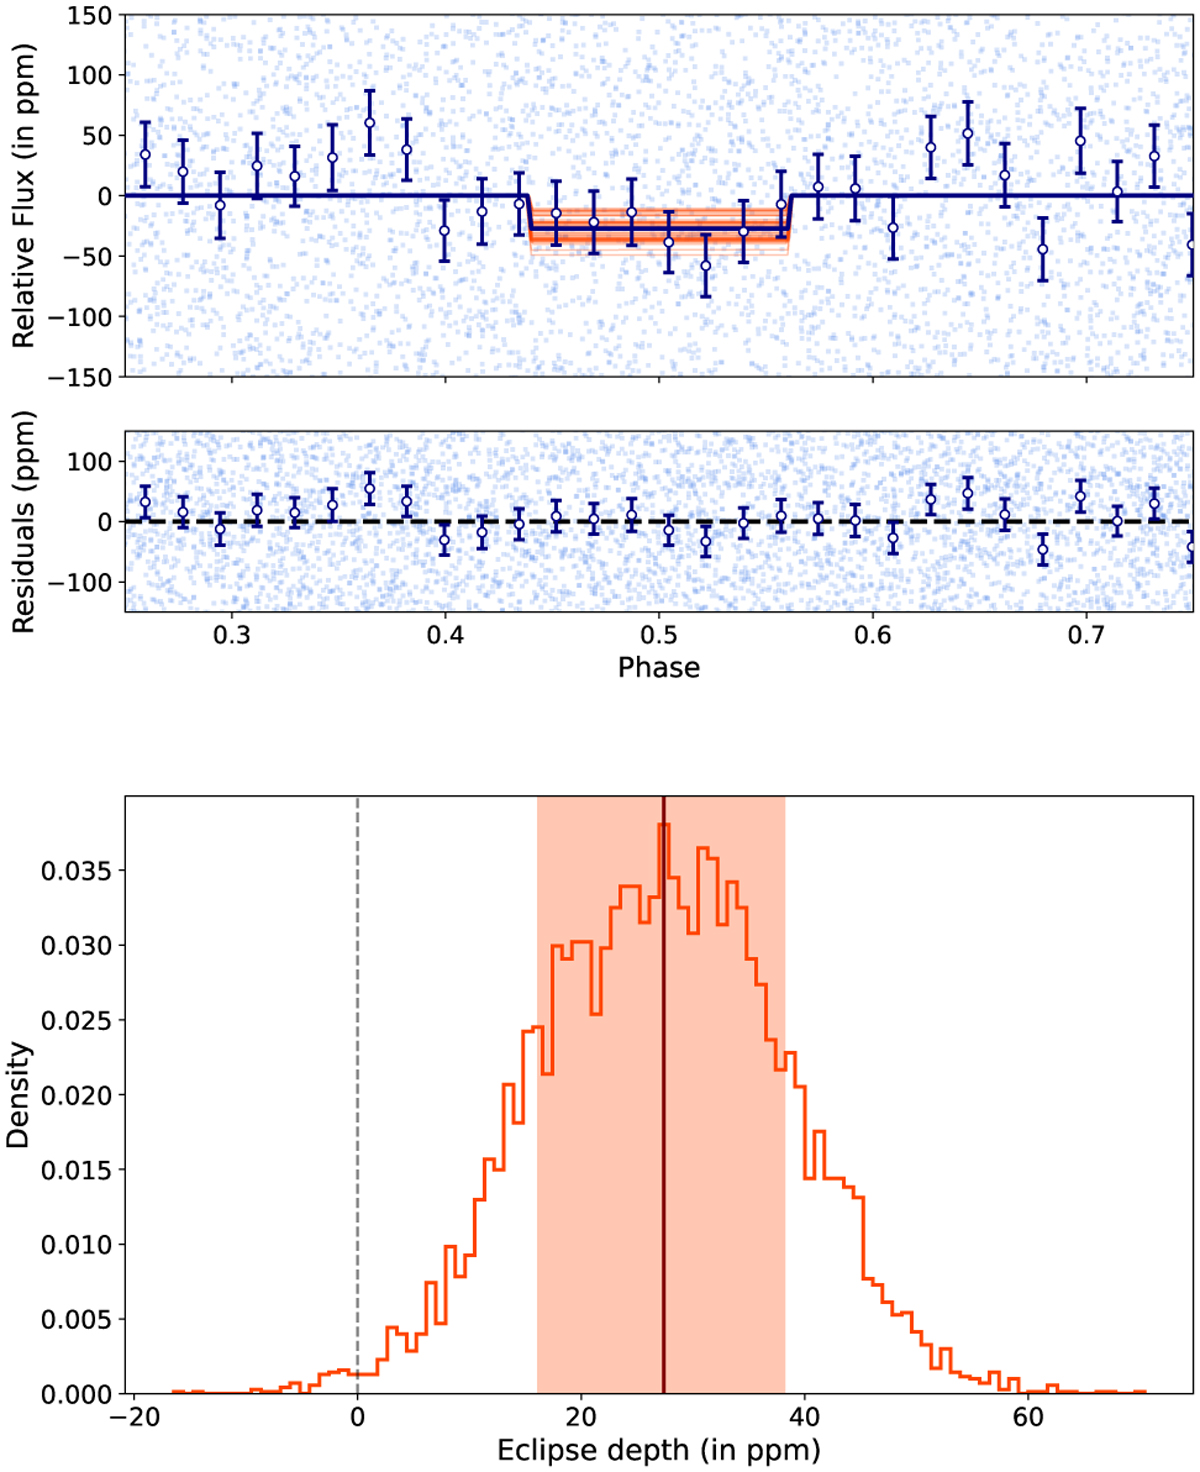
Best-fit eclipse model to the TESS data along with the posteriors of the eclipse depth. Top panel, upper plot: median fitted model (dark blue curve), which includes the planet transit and eclipse, and the original (light blue) and binned data points (dark blue) from four TESS sectors. The orange curves are the models computed from the randomly chosen samples from the posteriors. The lower plot shows the residuals for the fit. Bottom panel: posterior distribution of the eclipse depth. The dark orange line and the light orange band give the median eclipse depth and the 1σ credible interval. The dashed line represents the null hypothesis.
Current usage metrics show cumulative count of Article Views (full-text article views including HTML views, PDF and ePub downloads, according to the available data) and Abstracts Views on Vision4Press platform.
Data correspond to usage on the plateform after 2015. The current usage metrics is available 48-96 hours after online publication and is updated daily on week days.
Initial download of the metrics may take a while.