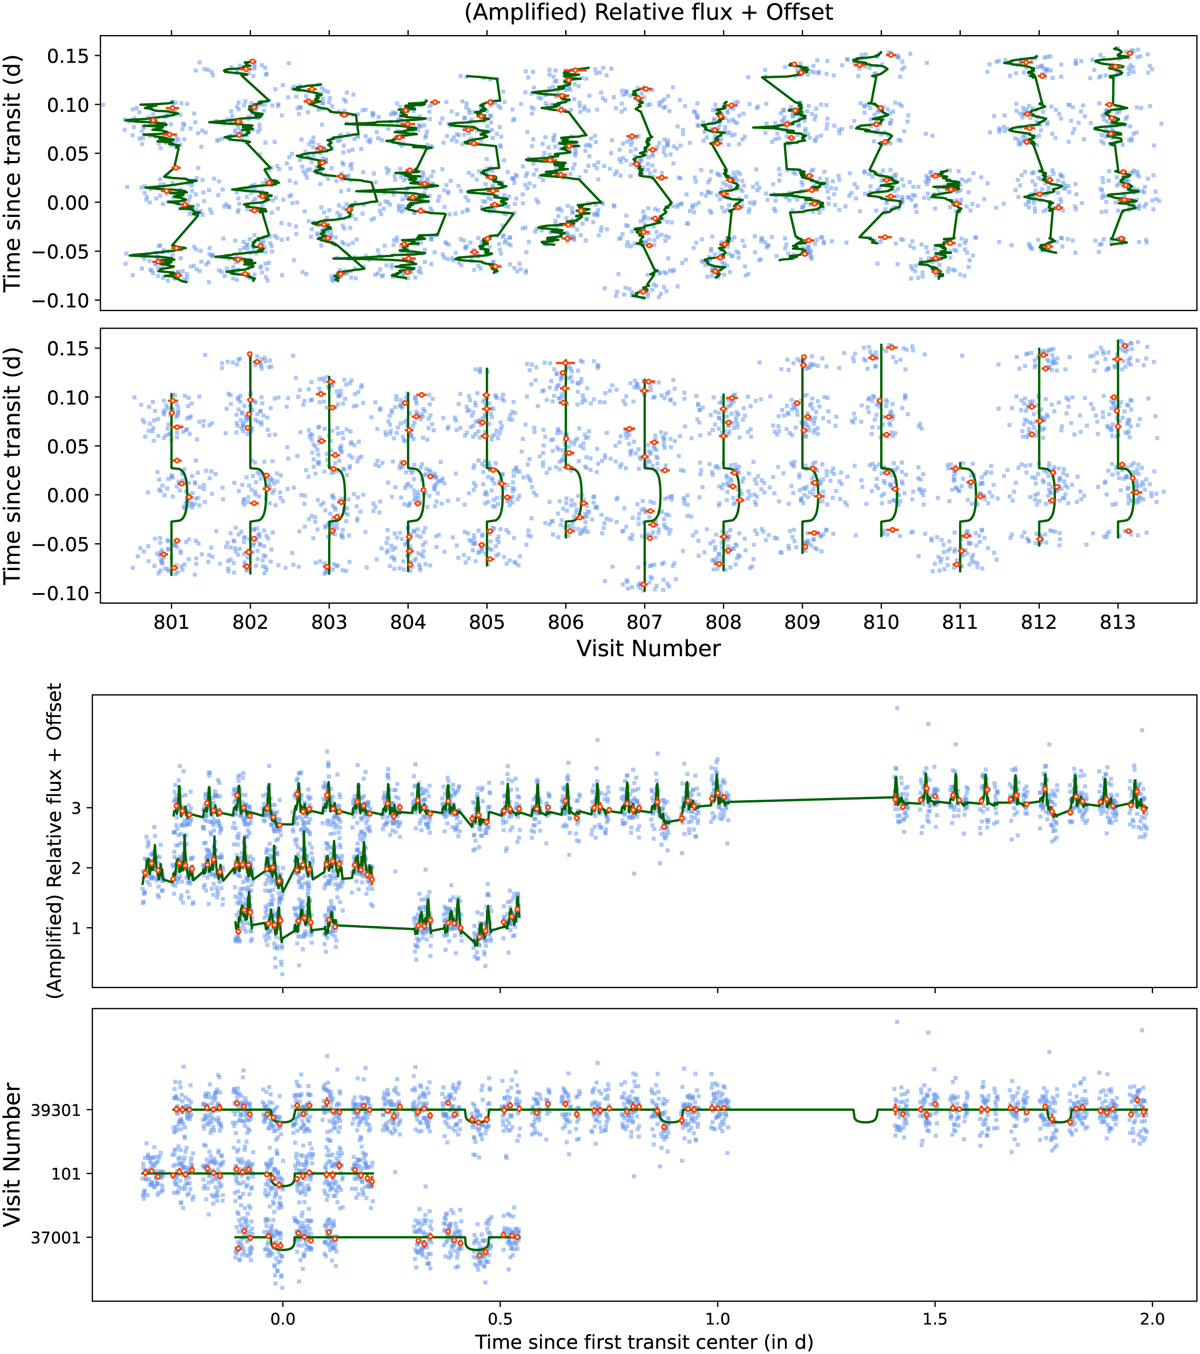
Fig. B.1
Download original image
Raw and detrended CHEOPS observations. (a): Raw (top panel) and detrended photometry (bottom panel) for our new CHEOPS observations. The blue and orange points are the original and binned data points, respectively. The fitted median full model (top) and transit model (bottom) is shown as dark green lines. (b): Same as (a), but for archival CHEOPS visits. For clarity, the transit signals from other planets have been masked.
Current usage metrics show cumulative count of Article Views (full-text article views including HTML views, PDF and ePub downloads, according to the available data) and Abstracts Views on Vision4Press platform.
Data correspond to usage on the plateform after 2015. The current usage metrics is available 48-96 hours after online publication and is updated daily on week days.
Initial download of the metrics may take a while.