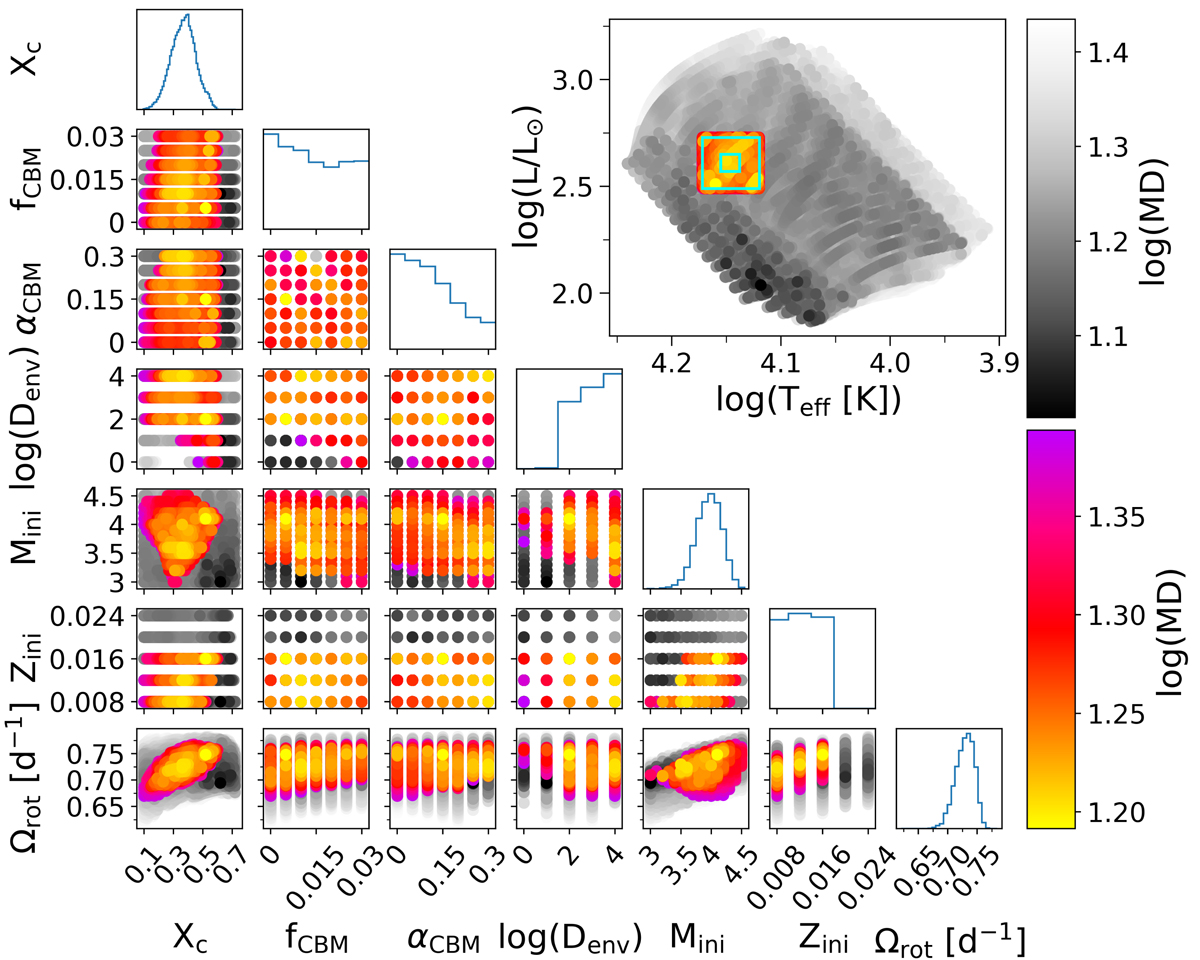
Fig. 9.
Download original image
Corner plot for the radiative grid. Made using period spacings in a Mahalanobis distance merit function and spectroscopic and luminosity constraints from the primary star. The 50% best models are shown, colour-coded according to the log of their merit function value (at right). The models in colour fall within the 2σ error ellipse of the MD constructed using Eq. (9), whilst the models in grey fall outside of this error ellipse. The figures on the diagonal show binned parameter distributions of the models in the error ellipse, and the panel at the top right shows a Hertzsprung–Russell diagram with the 1 and 3σTeff and log L error boxes.
Current usage metrics show cumulative count of Article Views (full-text article views including HTML views, PDF and ePub downloads, according to the available data) and Abstracts Views on Vision4Press platform.
Data correspond to usage on the plateform after 2015. The current usage metrics is available 48-96 hours after online publication and is updated daily on week days.
Initial download of the metrics may take a while.