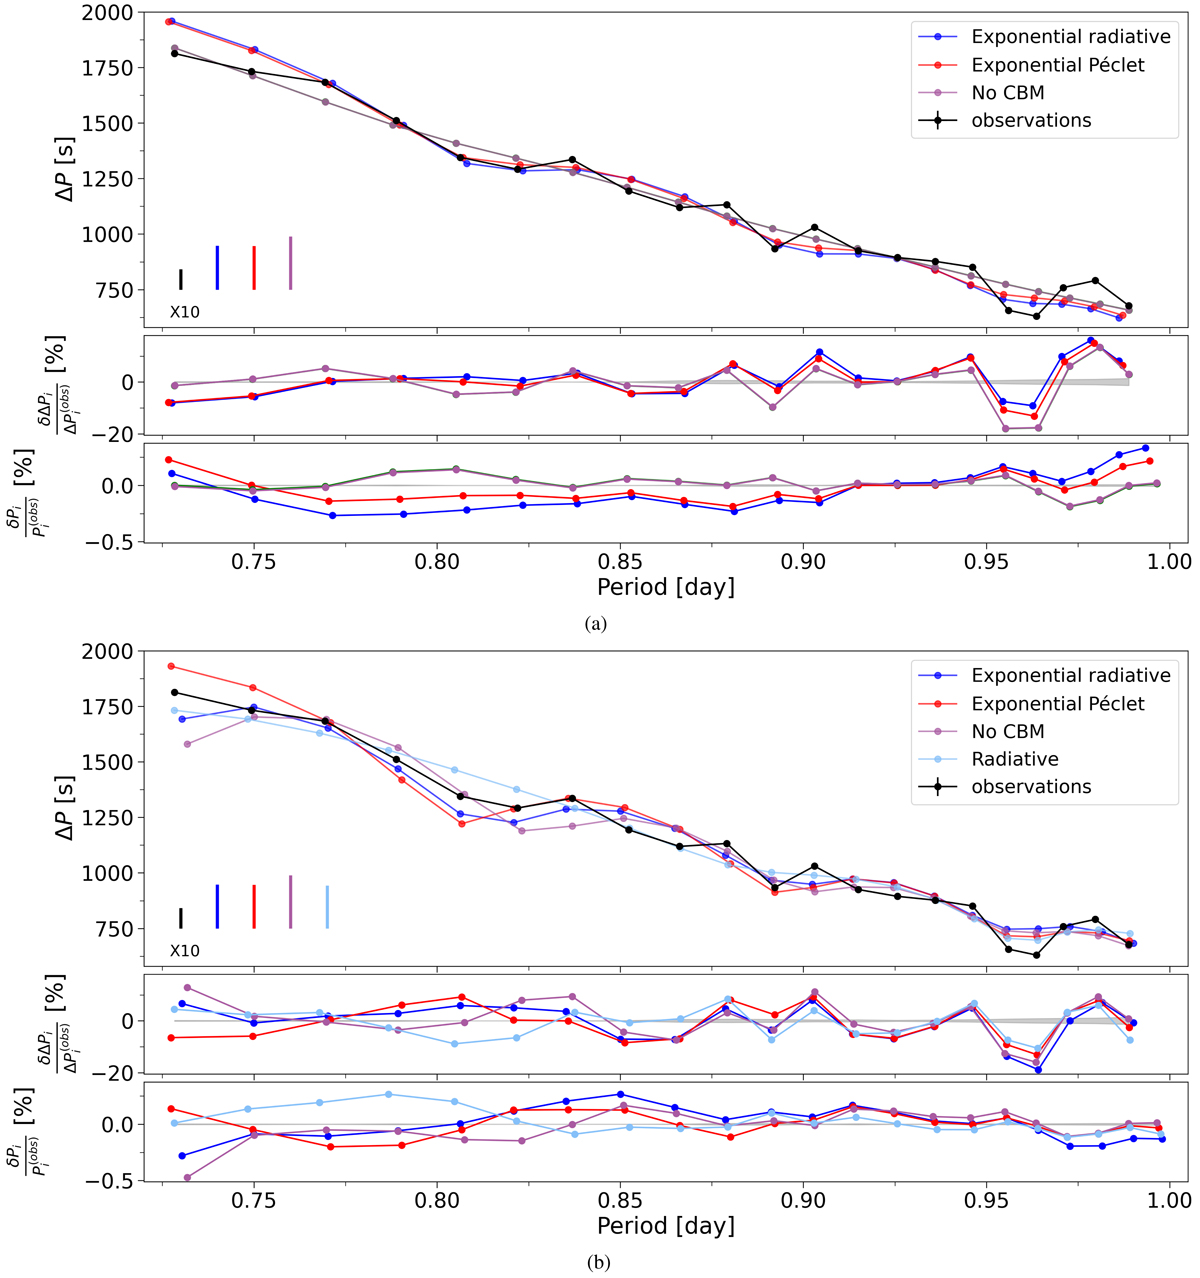
Fig. 13.
Download original image
Period-spacing patterns of the observations, and of the best models of the preferred grids that are not distinguishable from one another. These are the models in bold in Tables 5 and 6 that use ΔP as observables. The formal errors on the observations are smaller than the symbol sizes. The largest of the observational errors is enlarged ten times and shown for comparison. The vertical bars in the bottom left corner of the top panel show the maximum considered uncertainty for the theoretical predictions approximated by the variance-covariance matrix of that particular grid. The middle and bottom panels show the relative difference in period spacing and period, respectively, between the observation and the model. The narrow grey areas indicate the formal 1σ observational uncertainty from Table B.2.
Current usage metrics show cumulative count of Article Views (full-text article views including HTML views, PDF and ePub downloads, according to the available data) and Abstracts Views on Vision4Press platform.
Data correspond to usage on the plateform after 2015. The current usage metrics is available 48-96 hours after online publication and is updated daily on week days.
Initial download of the metrics may take a while.