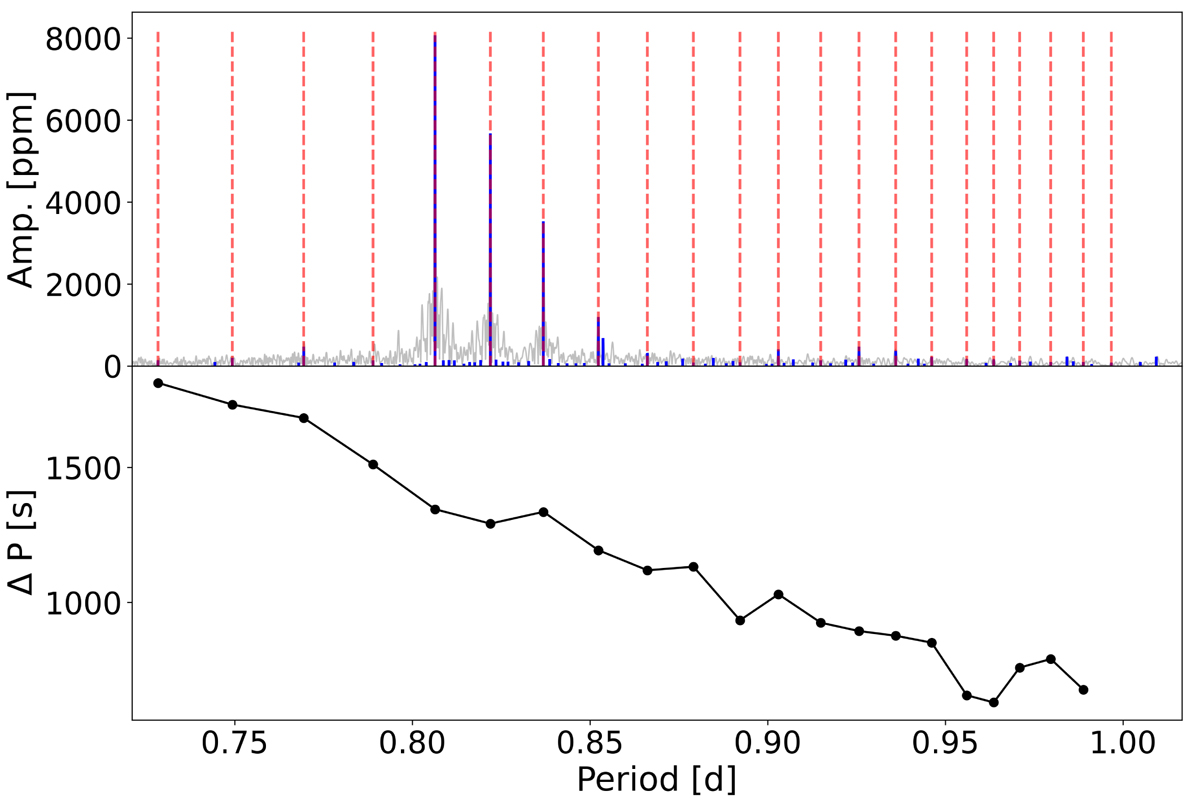
Fig. 1.
Download original image
Prograde dipole g-mode pattern of KIC 4930889. The top panel shows the amplitude spectrum in grey and the frequencies extracted by Van Beeck et al. (2021) in blue. The frequencies selected to be part of the prograde dipole mode pattern are indicated by dashed red lines. The bottom panel shows the period-spacing pattern (ΔPn ≡ Pn + 1 − Pn) of the selected prograde dipole modes.
Current usage metrics show cumulative count of Article Views (full-text article views including HTML views, PDF and ePub downloads, according to the available data) and Abstracts Views on Vision4Press platform.
Data correspond to usage on the plateform after 2015. The current usage metrics is available 48-96 hours after online publication and is updated daily on week days.
Initial download of the metrics may take a while.