Fig. 2.
Download original image
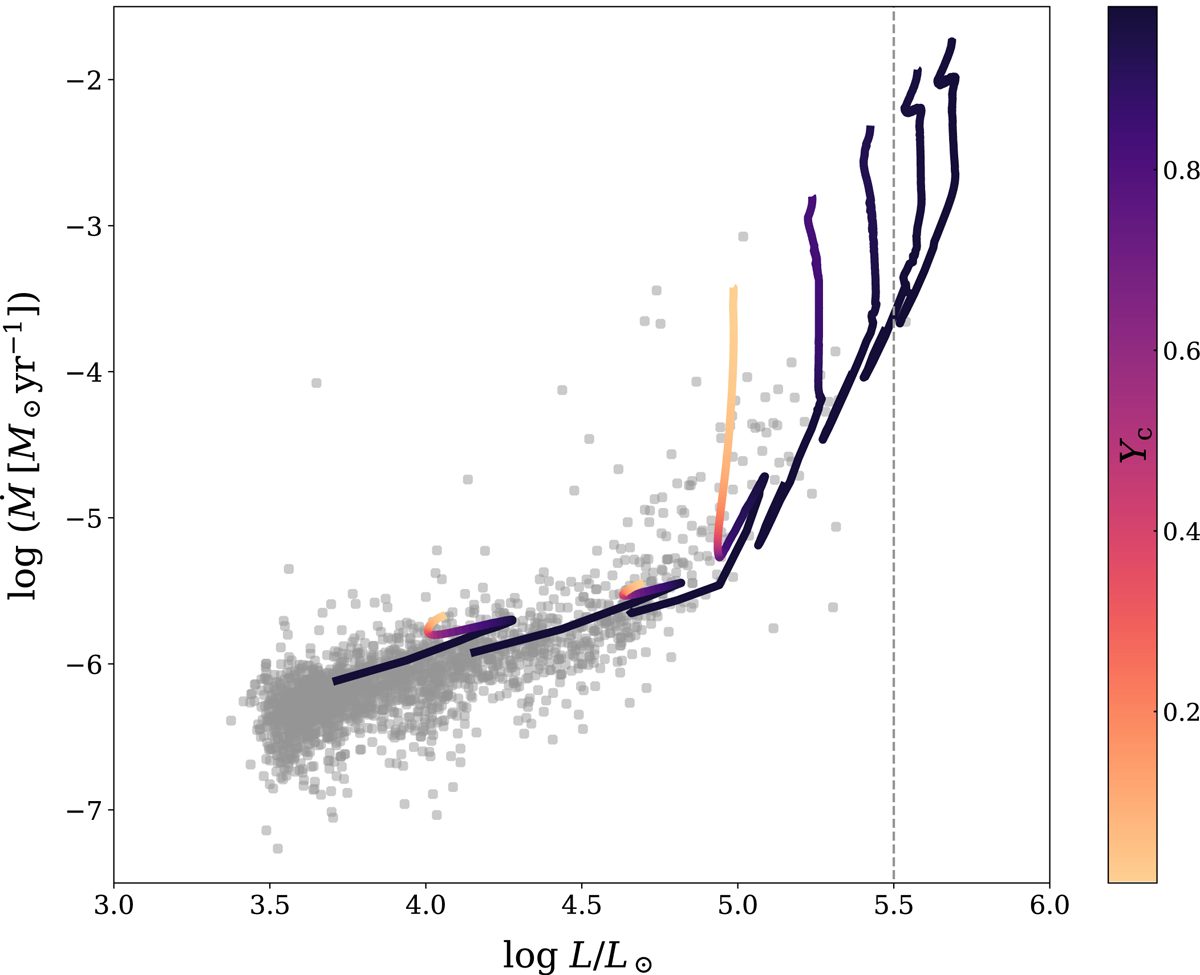
Mass-loss implementation into MESA models. The background stars are mass-loss rates from Yang et al. (2023). Over-plotted are the mass-loss rates vs. luminosity relations from MESA evolution models from 10 M⊙ to 40 M⊙ in steps of 5 M⊙. The colour coding is according to the central helium abundance (YC). The dotted vertical line is the HD limit from Davies & Beasor (2020).
Current usage metrics show cumulative count of Article Views (full-text article views including HTML views, PDF and ePub downloads, according to the available data) and Abstracts Views on Vision4Press platform.
Data correspond to usage on the plateform after 2015. The current usage metrics is available 48-96 hours after online publication and is updated daily on week days.
Initial download of the metrics may take a while.