Fig. 18
Download original image
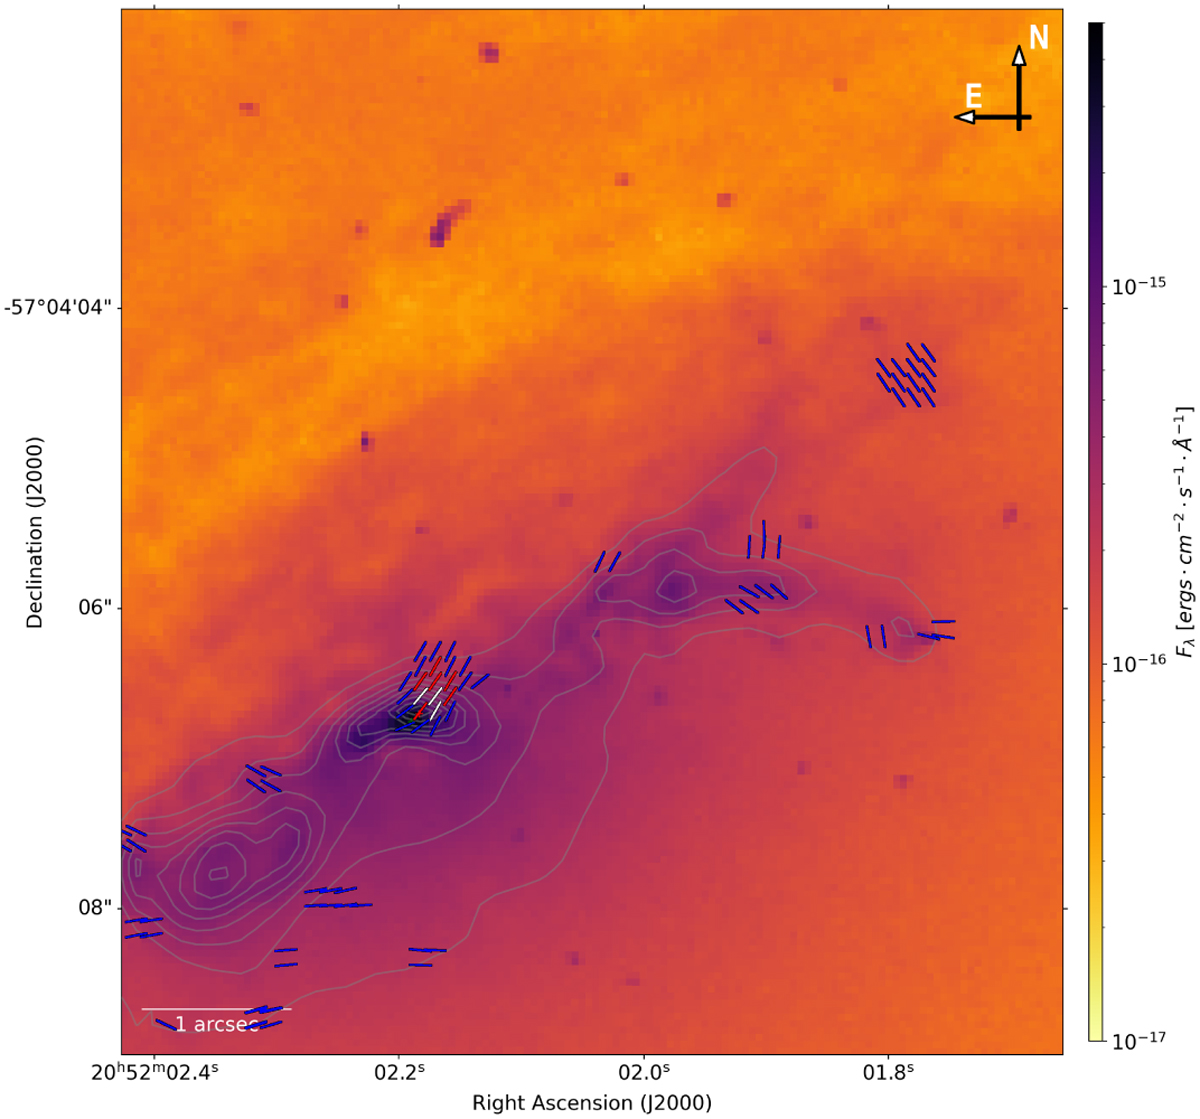
Total flux of IC 5063 at 5997 Å observed by HST/WFPC2 in 1995. The superimposed polarization vectors, shown with a constant length for better visualization, are taken from the polarization map at 4985 Å from this paper. They are displayed for the selected cut of [S/N]I ≥ 30 and [S/N]P ≥ 3 in white, for [S/N]P ≥ 2 in red and for [S/N]P ≥ 1 in blue (less significative). Both maps have been aligned on the croissant-shaped high flux region.
Current usage metrics show cumulative count of Article Views (full-text article views including HTML views, PDF and ePub downloads, according to the available data) and Abstracts Views on Vision4Press platform.
Data correspond to usage on the plateform after 2015. The current usage metrics is available 48-96 hours after online publication and is updated daily on week days.
Initial download of the metrics may take a while.