Fig. 9
Download original image
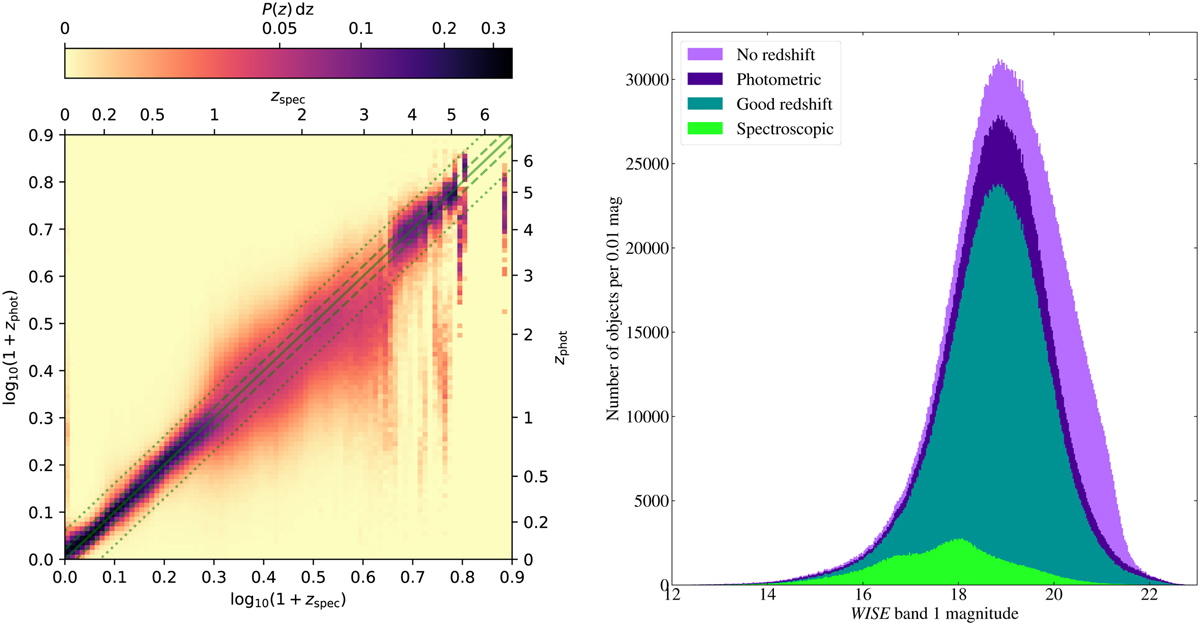
Statistics of the photometric and spectroscopic redshifts. Left: photo-z posterior distributions as a function of SDSS spectroscopic redshift for LoTSS DR2 sources with reliable spectroscopic redshift (zwarning_sdss = 0) and photo-z estimates that pass the photo-z quality selection (flag_qual = 1). The photo-z distribution is normalized such that the distribution for each zspec bin integrates to unity. Dashed and dotted lines illustrate the bounds zphot = zspec ± 0.05 and 0.15 × (1 + z) respectively. Right: the distribution of available redshifts for all optically identified objects as a function of WISE band 1 magnitude, where a ‘good redshift’ is defined in the text.
Current usage metrics show cumulative count of Article Views (full-text article views including HTML views, PDF and ePub downloads, according to the available data) and Abstracts Views on Vision4Press platform.
Data correspond to usage on the plateform after 2015. The current usage metrics is available 48-96 hours after online publication and is updated daily on week days.
Initial download of the metrics may take a while.