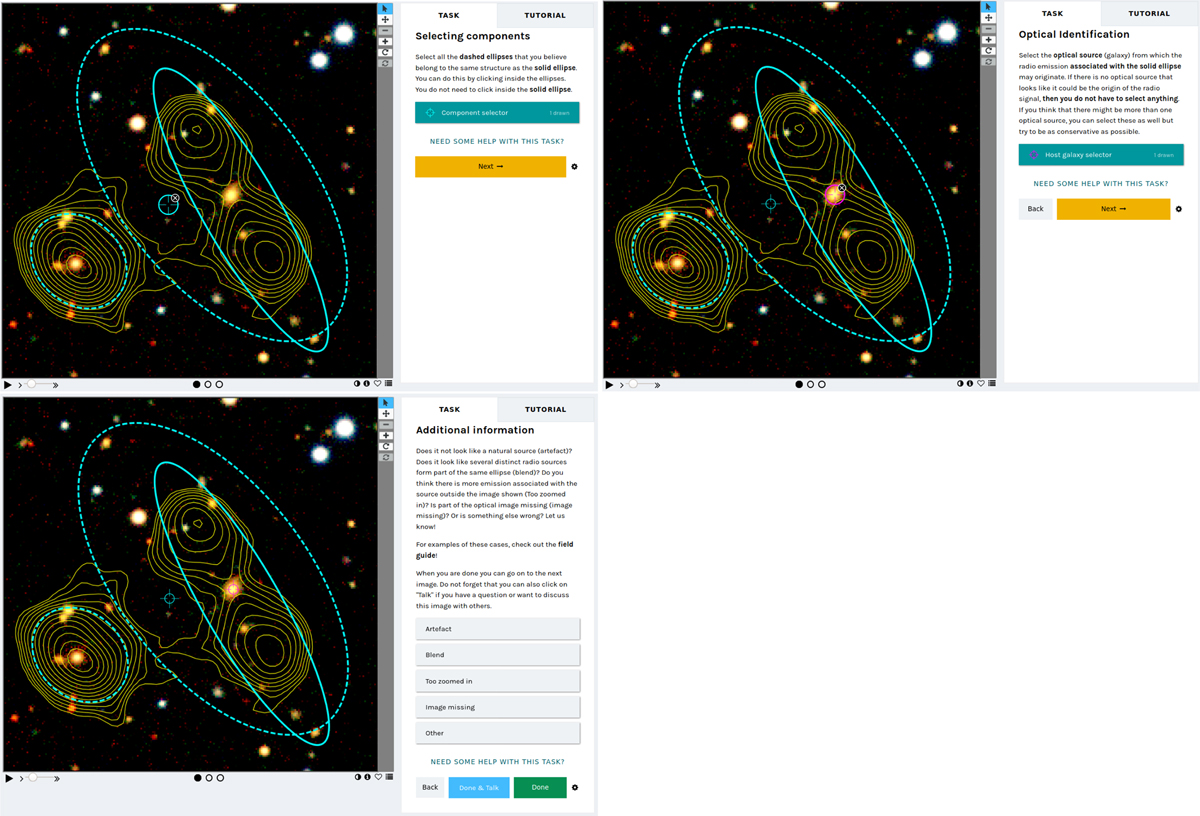
Fig. 4
Download original image
Images from the classification section of the Zooniverse interface. This shows the three task screens presented for one catalogued source, ILTJ172125.82+370417.2, seen by the user in the order top left, top right, bottom left panels. The image shown here is 100 arcsec on a side. All three views here show the standard image (Legacy colour scale, radio contours, and ellipses to represent catalogued Gaussians). In the first panel, the marker for an associated component can be seen; in the second panel, the user has also marked an optical identification for the radio source. In the third panel, the user has the opportunity to apply various flags to the source or to discuss it on the talk pages. Note the unassociated radio source to the southeast (bottom left). The toolbar below the image allows the user to switch images, to get information on the source, to invert the colour map, or to add the source to a list of favourites. Additionally, the user has the option to zoom, pan, and rotate the image using the buttons on the right.
Current usage metrics show cumulative count of Article Views (full-text article views including HTML views, PDF and ePub downloads, according to the available data) and Abstracts Views on Vision4Press platform.
Data correspond to usage on the plateform after 2015. The current usage metrics is available 48-96 hours after online publication and is updated daily on week days.
Initial download of the metrics may take a while.