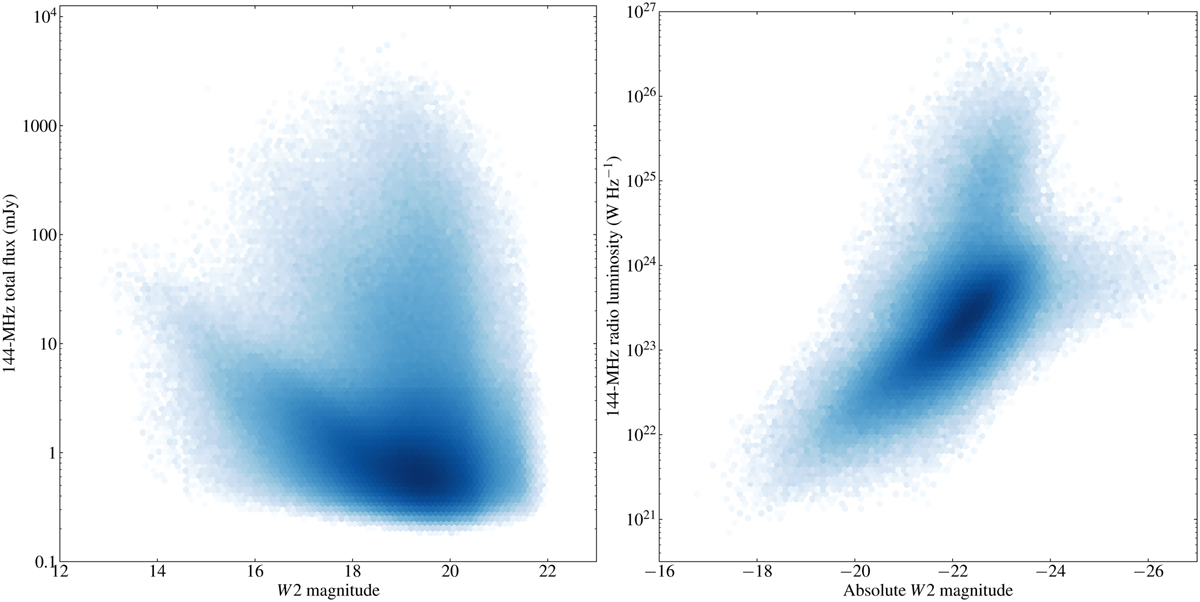
Fig. 12
Download original image
Relations between radio and optical properties of objects in the catalogue. Left: logarithmic density plot of 3 226 797 WISE-detected DR2 sources showing total LOFAR flux density against WISE band 2 AB magnitude. Right: logarithmic density plot of 851 356 DR2 sources with good WISE magnitudes and zbest < 0.5 showing total 144-MHz radio luminosity against WISE band 2 absolute AB magnitude, with approximate K-correction using the W1–W2 colour.
Current usage metrics show cumulative count of Article Views (full-text article views including HTML views, PDF and ePub downloads, according to the available data) and Abstracts Views on Vision4Press platform.
Data correspond to usage on the plateform after 2015. The current usage metrics is available 48-96 hours after online publication and is updated daily on week days.
Initial download of the metrics may take a while.