Fig. 6
Download original image
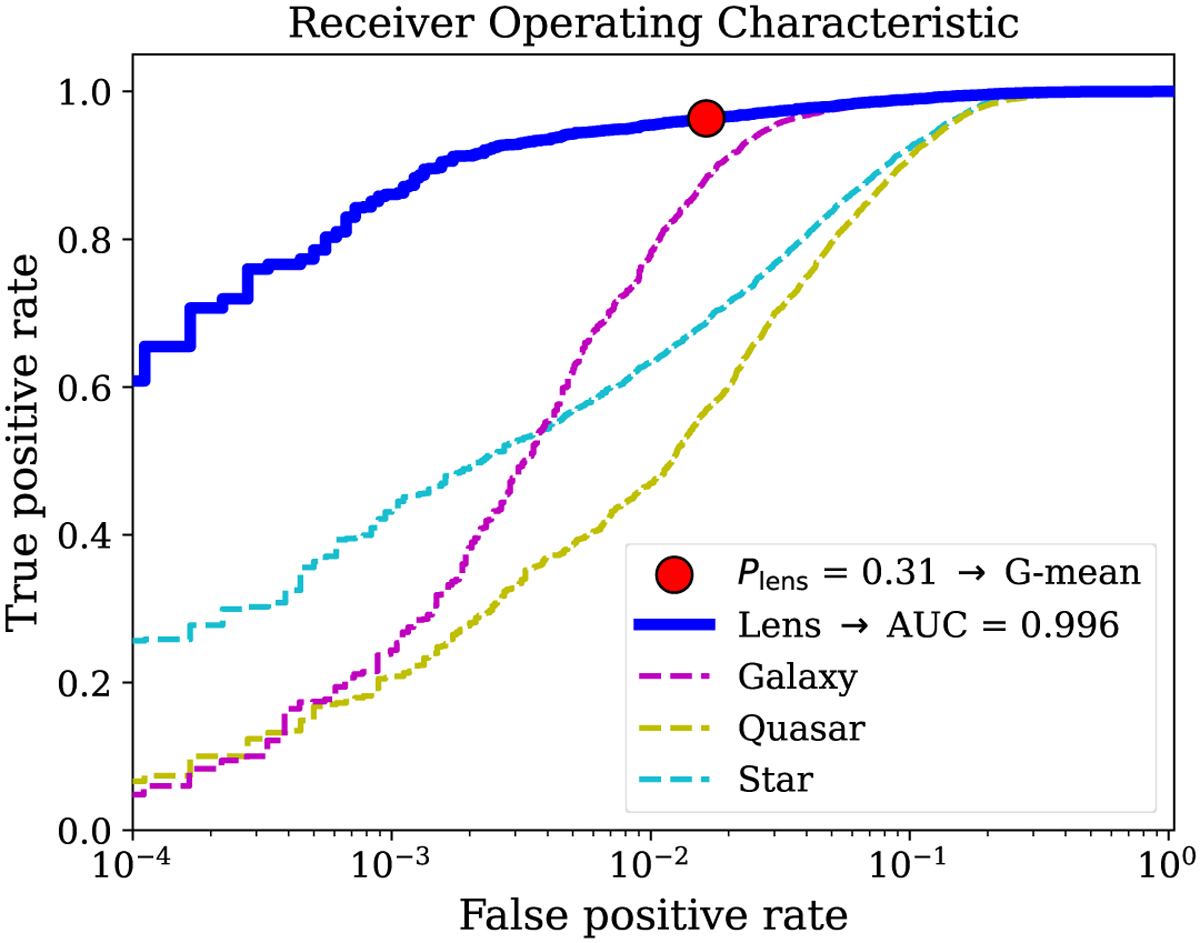
Curves of the receiver operating characteristic and its area under the curve (AUC) calculation are presented. A solid blue line indicates the curve for categorizing lensed quasars. The curves for classifying galaxies, quasars, and stars, are also illustrated as magenta, yellow, and cyan dashed lines, respectively. Finally, a red circle represents the FPR and TPR values for the chosen Plens limit.
Current usage metrics show cumulative count of Article Views (full-text article views including HTML views, PDF and ePub downloads, according to the available data) and Abstracts Views on Vision4Press platform.
Data correspond to usage on the plateform after 2015. The current usage metrics is available 48-96 hours after online publication and is updated daily on week days.
Initial download of the metrics may take a while.