Fig. 5
Download original image
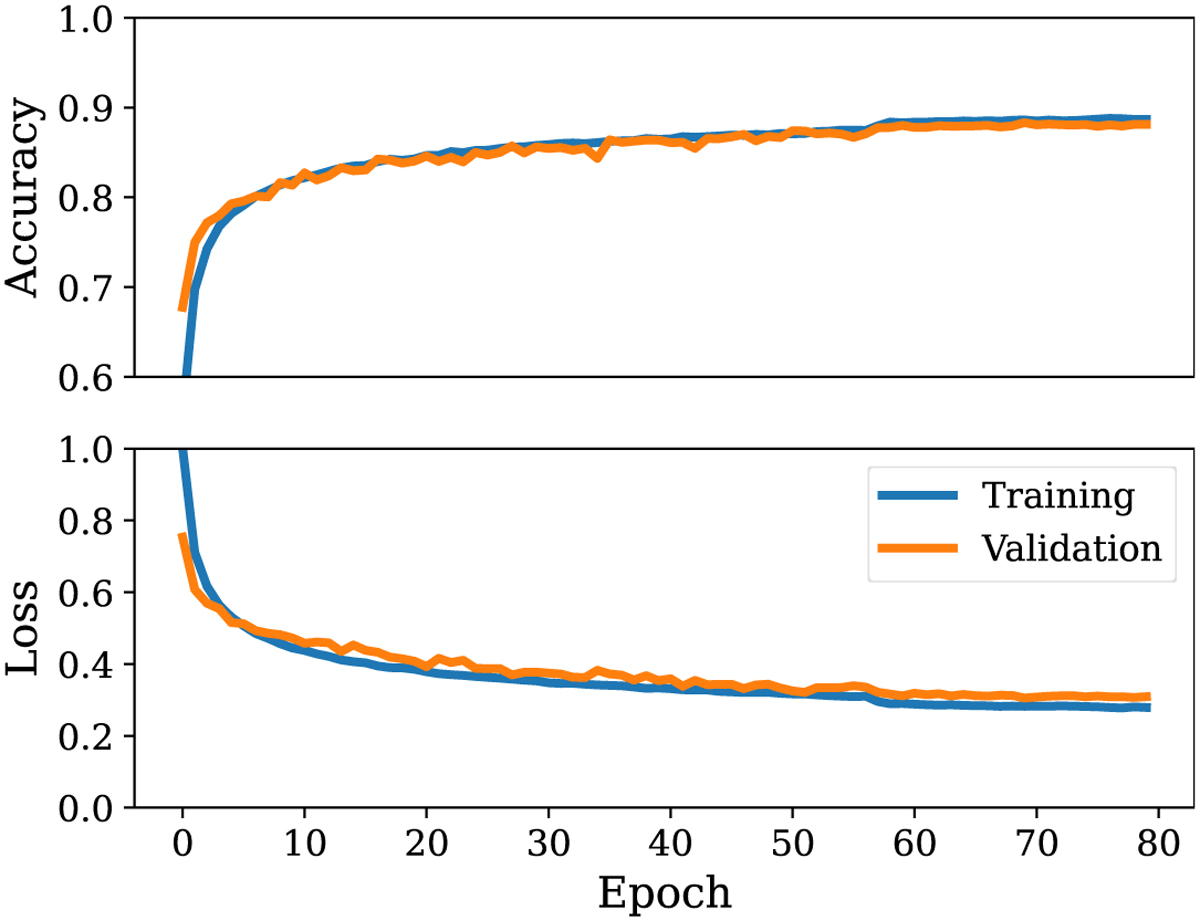
Example of accuracy and loss curves as a function of the training epoch of ViT-Lite, one of the top-performing models, is displayed in the upper and lower panels. The other classifiers also show a similar increasing accuracy and decreasing loss trend, indicating that they are able to learn. These metrics are inferred by testing the network on the training and validation datasets, which are subsequently depicted as blue and orange lines, respectively.
Current usage metrics show cumulative count of Article Views (full-text article views including HTML views, PDF and ePub downloads, according to the available data) and Abstracts Views on Vision4Press platform.
Data correspond to usage on the plateform after 2015. The current usage metrics is available 48-96 hours after online publication and is updated daily on week days.
Initial download of the metrics may take a while.