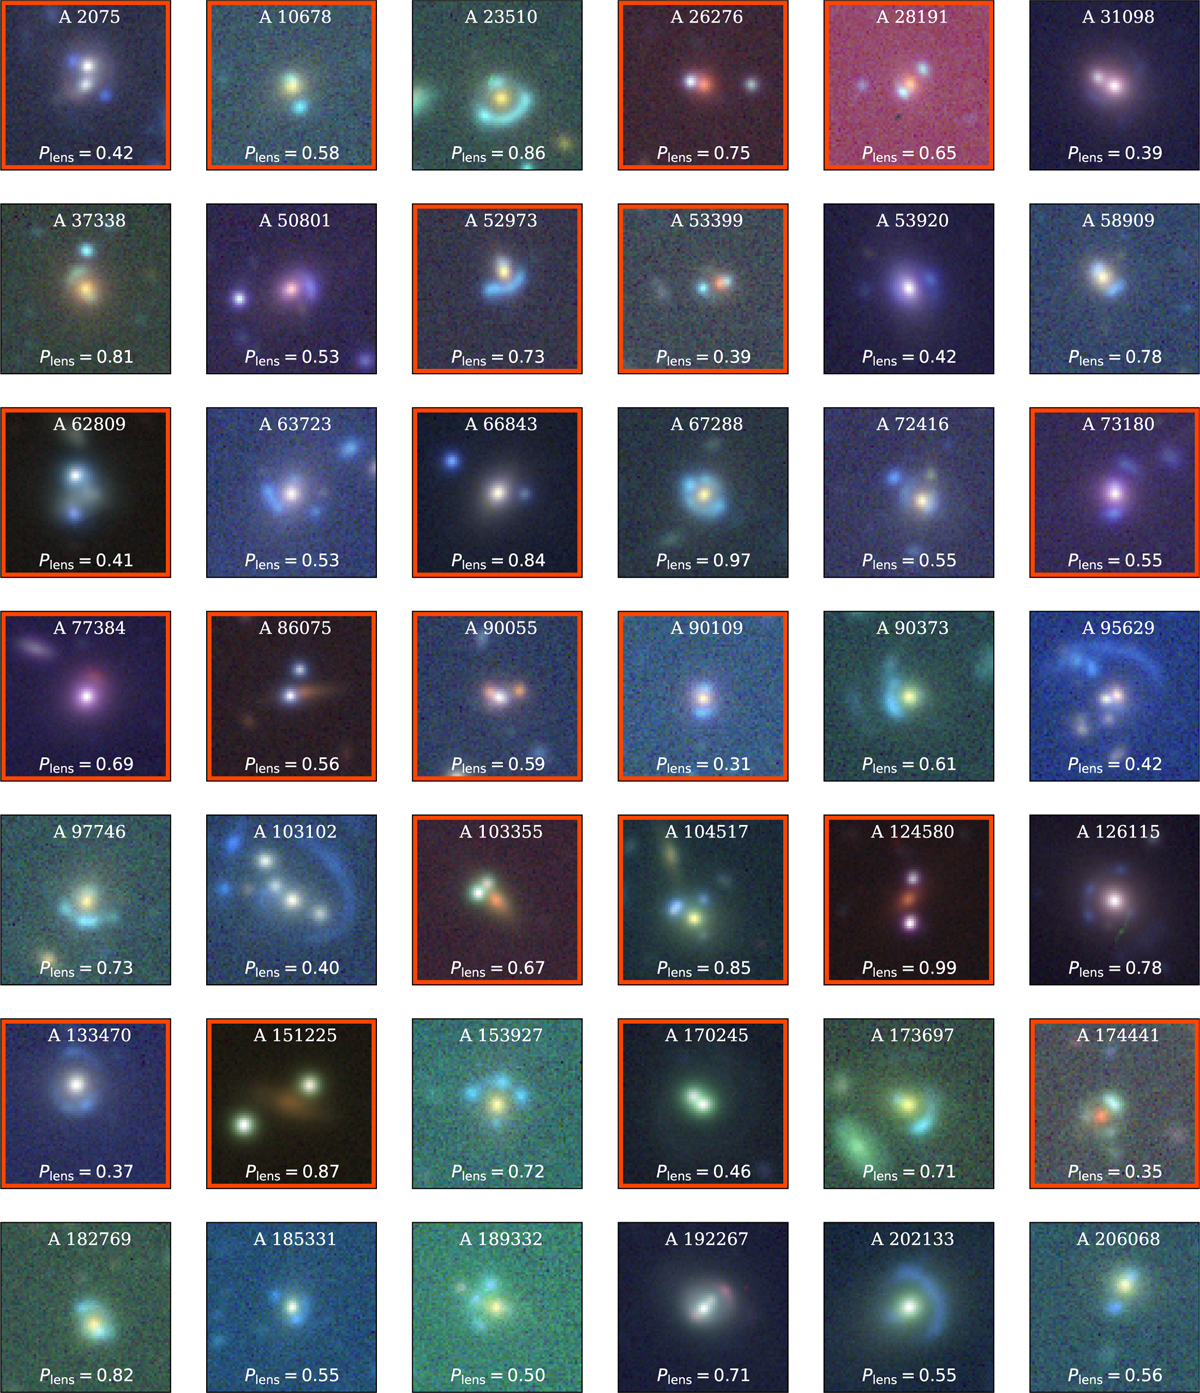
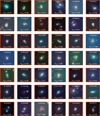
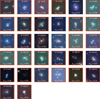
Fig. B.1
Download original image
The 12″ × 12″ ɡrz-color images of our lens candidates are shown. To enhance the visual contrast of each HSC cutout, we apply a square-root stretch to the fluxes. We also display the grade determined from our visual inspection and the identification number of each target on top of the panel. At the bottom side, we report the lens probability inferred by our automated classifier. Newly discovered sources in this work, along with some candidates that are also independently published by Chan et al. (2023) that are not listed in the MLD and GLQD, are marked with red rectangles.
Current usage metrics show cumulative count of Article Views (full-text article views including HTML views, PDF and ePub downloads, according to the available data) and Abstracts Views on Vision4Press platform.
Data correspond to usage on the plateform after 2015. The current usage metrics is available 48-96 hours after online publication and is updated daily on week days.
Initial download of the metrics may take a while.