Fig. A.1
Download original image
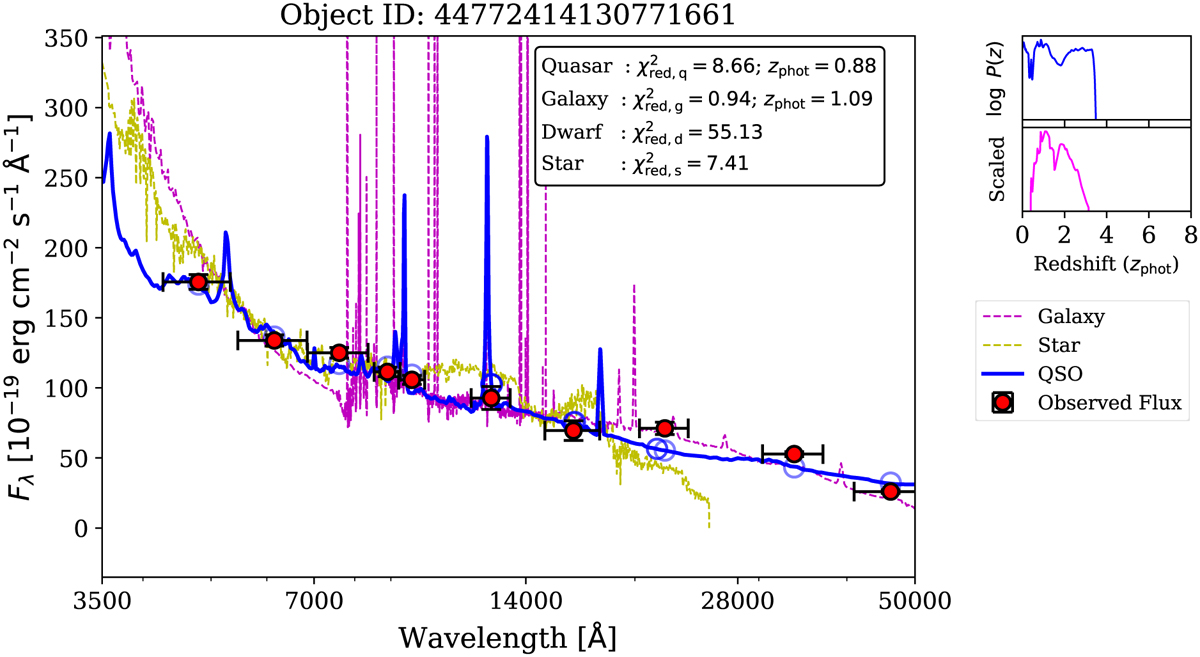
SED fitting result for a lensed quasar candidate is presented. In the main panel, the observed photometry of the source is depicted as red circles with error bars modeled with three distinct templates. The best-fit quasar spectral template is represented by a blue line, while the synthesized photometry is illustrated with blue circles. The yellow and magenta colors indicate the best-fit models using non-lensed star and galaxy templates, respectively. The right panel showcases the photometric redshift probability density functions obtained by fitting the data to templates of unlensed quasars (cyan line) and galaxies (magenta line).
Current usage metrics show cumulative count of Article Views (full-text article views including HTML views, PDF and ePub downloads, according to the available data) and Abstracts Views on Vision4Press platform.
Data correspond to usage on the plateform after 2015. The current usage metrics is available 48-96 hours after online publication and is updated daily on week days.
Initial download of the metrics may take a while.