Open Access
Fig. 6.
Download original image
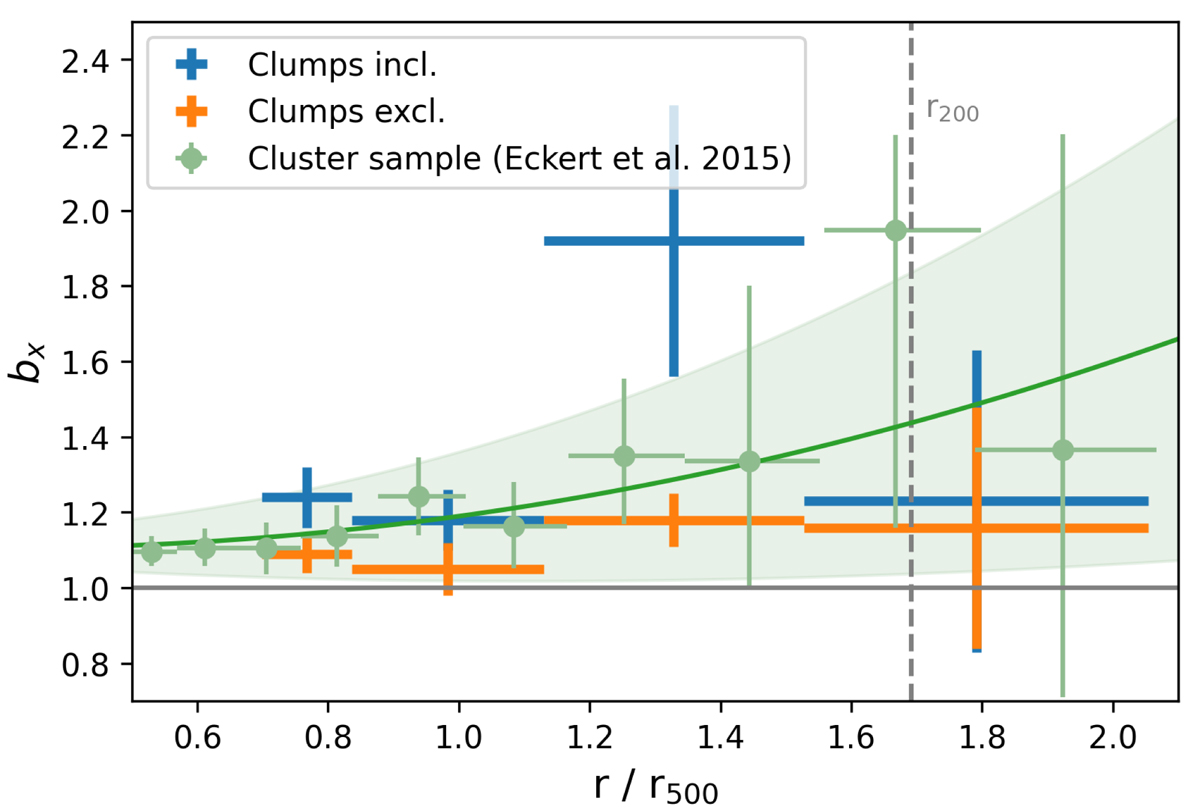
Azimuthally averaged emissivity bias profiles before (blue) and after (orange) removal of the identified clumps. The overplotted green points and shaded region denote the measurements obtained for a sample of 31 clusters and their best-fit profile using a second order polynomial, as reported in Eckert et al. (2015).
Current usage metrics show cumulative count of Article Views (full-text article views including HTML views, PDF and ePub downloads, according to the available data) and Abstracts Views on Vision4Press platform.
Data correspond to usage on the plateform after 2015. The current usage metrics is available 48-96 hours after online publication and is updated daily on week days.
Initial download of the metrics may take a while.