Fig. 5.

Download original image
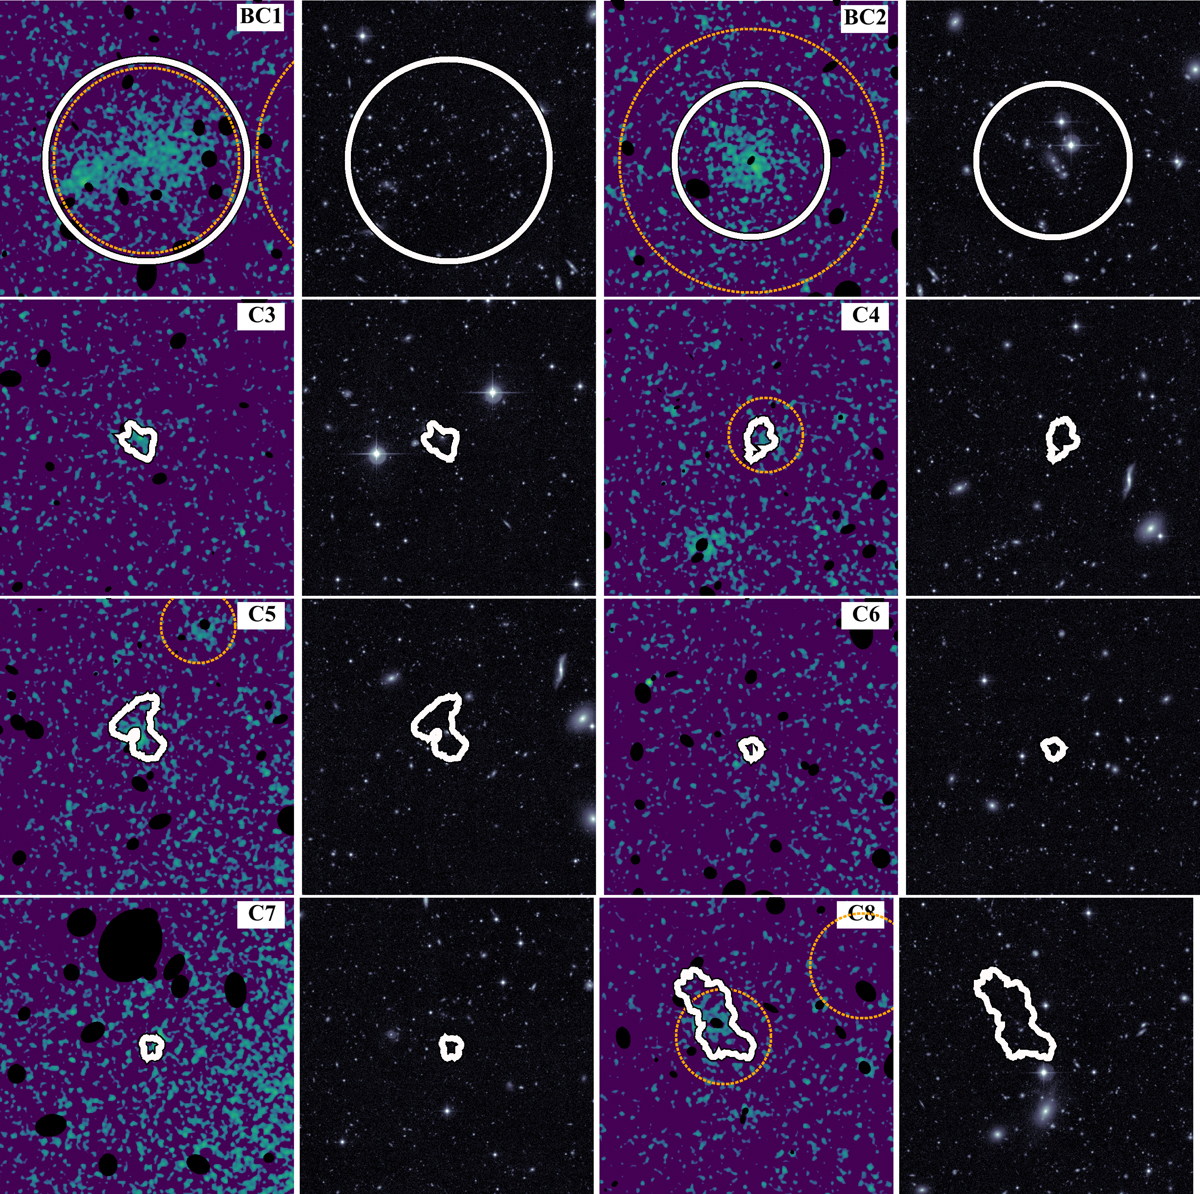
0.5–3 keV cut-out images for clump candidates (white regions). Left: Each Chandra image has a size of 200″ × 200″ (0.2 Mpc × 0.2 Mpc) and is smoothed with a Gaussian function with a kernel of 6 pixels. Filled black ellipses represent excluded wavdetect sources. The orange dashed circles mark the r500 radius of background clusters (Zou et al. 2021). Right:r-band CFHT image showing the same field of view.
Current usage metrics show cumulative count of Article Views (full-text article views including HTML views, PDF and ePub downloads, according to the available data) and Abstracts Views on Vision4Press platform.
Data correspond to usage on the plateform after 2015. The current usage metrics is available 48-96 hours after online publication and is updated daily on week days.
Initial download of the metrics may take a while.


