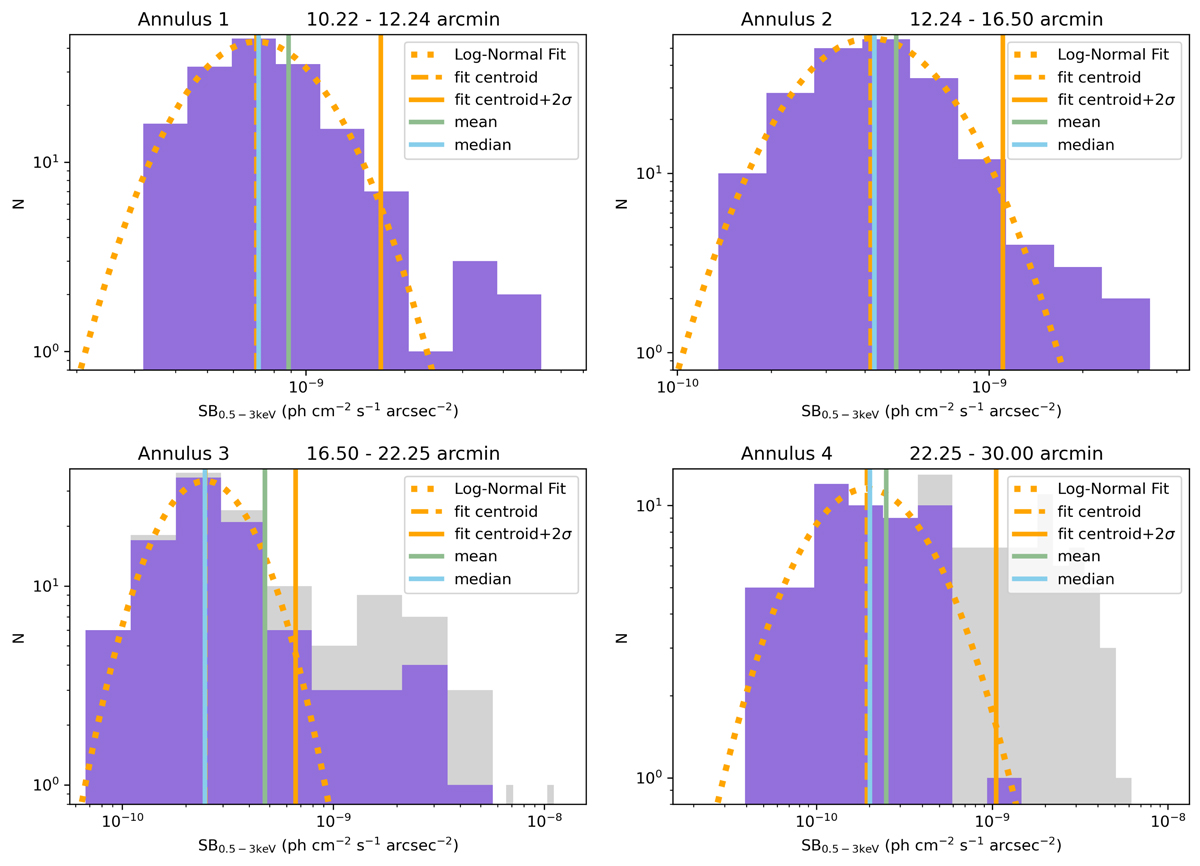
Fig. 4.
Download original image
0.5–3 keV surface brightness distribution of Abell 133 outskirts obtained in 4 annuli, mapping from 10.2′ to 30.0′ as listed in Table 3. The histogram in grey shows the contribution from the large, bright diffuse features in the southeast, which have been excluded from further analysis. The solid orange line marks the 2σ outlier threshold.
Current usage metrics show cumulative count of Article Views (full-text article views including HTML views, PDF and ePub downloads, according to the available data) and Abstracts Views on Vision4Press platform.
Data correspond to usage on the plateform after 2015. The current usage metrics is available 48-96 hours after online publication and is updated daily on week days.
Initial download of the metrics may take a while.