Fig. 11.
Download original image
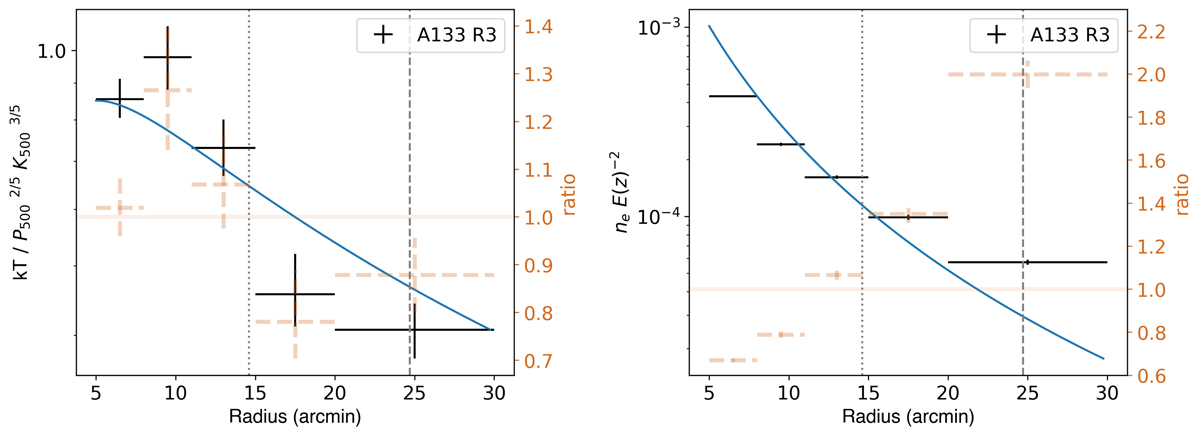
Self-similarly scaled temperature and density profiles of Abell 133. The dotted and dashed lines show the radius of r500 and r200, respectively. P500 and K500 are defined in Sect. 7. The reference model derived from the referenced pressure and entropy profiles is denoted with a blue solid curve. The orange dashed points represent the ratio between the measurements and the reference models, for better comparison.
Current usage metrics show cumulative count of Article Views (full-text article views including HTML views, PDF and ePub downloads, according to the available data) and Abstracts Views on Vision4Press platform.
Data correspond to usage on the plateform after 2015. The current usage metrics is available 48-96 hours after online publication and is updated daily on week days.
Initial download of the metrics may take a while.