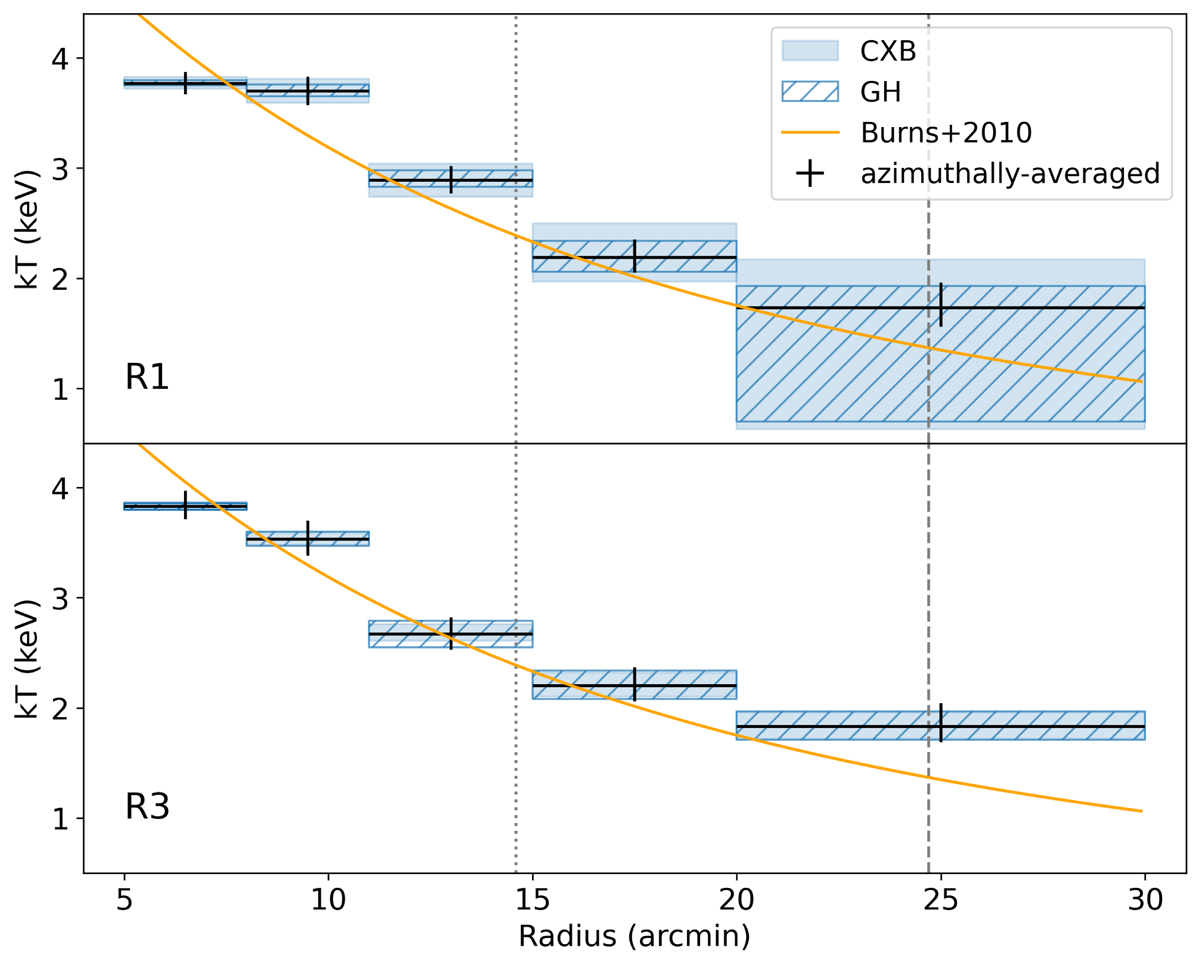
Fig. 9.
Download original image
Suzaku temperature profile of Abell 133. Systematic uncertainties from best-fit GH model and CXB estimation are denoted by blue slash region and shaded region respectively. The upper and lower panels show the differences before and after removal of point sources (S2 − 8 > 5.67 × 10⁻¹⁵ erg cm−2 s−1) and clumps. The orange solid line represents the expectation from hydrodynamic cosmological simulations (Burns et al. 2010).
Current usage metrics show cumulative count of Article Views (full-text article views including HTML views, PDF and ePub downloads, according to the available data) and Abstracts Views on Vision4Press platform.
Data correspond to usage on the plateform after 2015. The current usage metrics is available 48-96 hours after online publication and is updated daily on week days.
Initial download of the metrics may take a while.